Arizona Senate
All 30 seats on the ballot. 16 for a majority
Democrats20
Republicans10
Forecast seats, about 82% counted. Currently leading: D 20, R 10.
 Electoral MeridianIndependent Election Research
Forecasts. Results. Evidence.
3 races undecided, about 89% counted, 2 changed party. The state's House vote has moved D +13.1 since 2024. D +11.5 since 2022.
All 30 seats on the ballot. 16 for a majority
Forecast seats, about 82% counted. Currently leading: D 20, R 10.
All 60 seats, two per district. 31 for a majority
Forecast seats, about 82% counted. Currently leading: D 37, R 23.
Nine districts
Forecast seats, about 82% counted. Currently leading: D 5, R 4. Called: D 5, R 1.
Only congressional and governor races get race calls. State legislative and other statewide estimates use each county's progress in the governor's race as a stand-in for how much of that contest is counted, so treat them as provisional.
Arizona reports early ballots first, so its count usually starts far more Democratic than it finishes. Election Day ballots follow that night, and late early ballots, dropped off on Election Day, over the next days.
In 2026, ballots counted after a place's first report ran about 21 points more Republican than that report, in the same places. An early Democratic lead here can shrink.
| Governor's race, by ballot type | Votes | Margin |
|---|---|---|
| Early ballots | 1,785,674 | D +17.8 |
| Early, A.R.S. 16-579 | 46,674 | R +2.1 |
| Election Day | 386,812 | R +8.3 |
| Late early ballots | 22,819 | R +4.0 |
How far has each county moved since the 2024 president?
Democrat aheadRepublican aheadNo changeThe patternStill under 90% countedFar from the pattern
Blue squares are good for Democrats and red for Republicans. The darker squares are counties voting differently for House than for president. Above the black line, a county moved toward Democrats.
15 moved toward Democrats, 0 toward Republicans. The middle shift is D +15.0.
Being far from the pattern is a reason to look, not a finding. Usual causes are a popular or weak candidate, an unopposed race last time, or a batch of ballots still to come.
How far has each county moved since the 2022 House vote?
Democrat aheadRepublican aheadNo changeThe patternStill under 90% counted
Blue squares are good for Democrats and red for Republicans. The darker squares are counties that changed sides. Above the black line, a county moved toward Democrats.
11 moved toward Democrats, 0 toward Republicans. The middle shift is D +10.0.
Did the state move together, or are some counties far from the rest?
Toward DemocratsToward RepublicansMiddle
Right of Even, in blue, moved toward Democrats, which is good for them. Left of it, in red, moved toward Republicans. Bars far from the main hump stand apart from the rest.
Being far from the pattern is a reason to look, not a finding. Usual causes are a popular or weak candidate, an unopposed race last time, or a batch of ballots still to come.
How far has each race on the ballot moved since 2024?
Democrat aheadRepublican aheadNo changeThe patternStill under 90% counted
Blue squares are good for Democrats and red squares for Republicans; the darker squares changed sides. Above the black line a race moved toward Democrats, even if it's still in a red square. Below it, toward Republicans.
39 moved toward Democrats, 0 toward Republicans. The middle shift is D +14.4.
How far has each race on the ballot moved since 2022?
Democrat aheadRepublican aheadNo changeThe patternStill under 90% counted
Blue squares are good for Democrats and red squares for Republicans; the darker squares changed sides. Above the black line a race moved toward Democrats, even if it's still in a red square. Below it, toward Republicans.
37 moved toward Democrats, 0 toward Republicans. The middle shift is D +11.7.
How far has each state Senate district moved since 2024? Only districts with both parties on both ballots.
Democrat aheadRepublican aheadNo changeThe patternStill under 90% countedFar from the pattern
Blue squares are good for Democrats and red squares for Republicans; the darker squares changed sides. Above the black line a race moved toward Democrats, even if it's still in a red square. Below it, toward Republicans.
17 moved toward Democrats, 0 toward Republicans. The middle shift is D +15.6.
Being far from the pattern is a reason to look, not a finding. Usual causes are a popular or weak candidate, an unopposed race last time, or a batch of ballots still to come.
How far has each state Senate district moved since 2022? Only districts with both parties on both ballots.
Democrat aheadRepublican aheadNo changeThe patternStill under 90% counted
Blue squares are good for Democrats and red squares for Republicans; the darker squares changed sides. Above the black line a race moved toward Democrats, even if it's still in a red square. Below it, toward Republicans.
18 moved toward Democrats, 0 toward Republicans. The middle shift is D +12.5.
How far has each state House district moved since 2024? Only districts with both parties on both ballots.
Democrat aheadRepublican aheadNo changeThe patternStill under 90% counted
Blue squares are good for Democrats and red squares for Republicans; the darker squares changed sides. Above the black line a race moved toward Democrats, even if it's still in a red square. Below it, toward Republicans.
14 moved toward Democrats, 0 toward Republicans. The middle shift is D +13.1.
How far has each state House district moved since 2022? Only districts with both parties on both ballots.
Democrat aheadRepublican aheadNo changeThe patternStill under 90% counted
Blue squares are good for Democrats and red squares for Republicans; the darker squares changed sides. Above the black line a race moved toward Democrats, even if it's still in a red square. Below it, toward Republicans.
7 moved toward Democrats, 0 toward Republicans. The middle shift is D +12.4.
| Race | Since 2024 | Since 2022 |
|---|---|---|
| Governor | — | D +12.0 |
| Secretary of State | — | D +6.0 |
| Attorney General | — | D +10.3 |
| Treasurer | — | D +18.3 |
| Superintendent of Public Instruction | — | D +6.1 |
| Corporation Commission | — | D +11.6 |
| District 1 | D +11.0 | D +8.1 |
| District 2 | D +7.7 | D +6.5 |
| District 4 | D +20.1 | D +15.3 |
| District 5 | D +18.2 | D +17.9 |
| District 6 | D +10.7 | D +9.6 |
| District 7 | D +16.4 | D +14.2 |
| District 8 | D +10.1 | — |
| District 9 | D +14.4 | — |




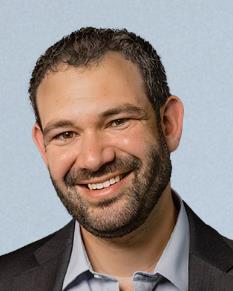

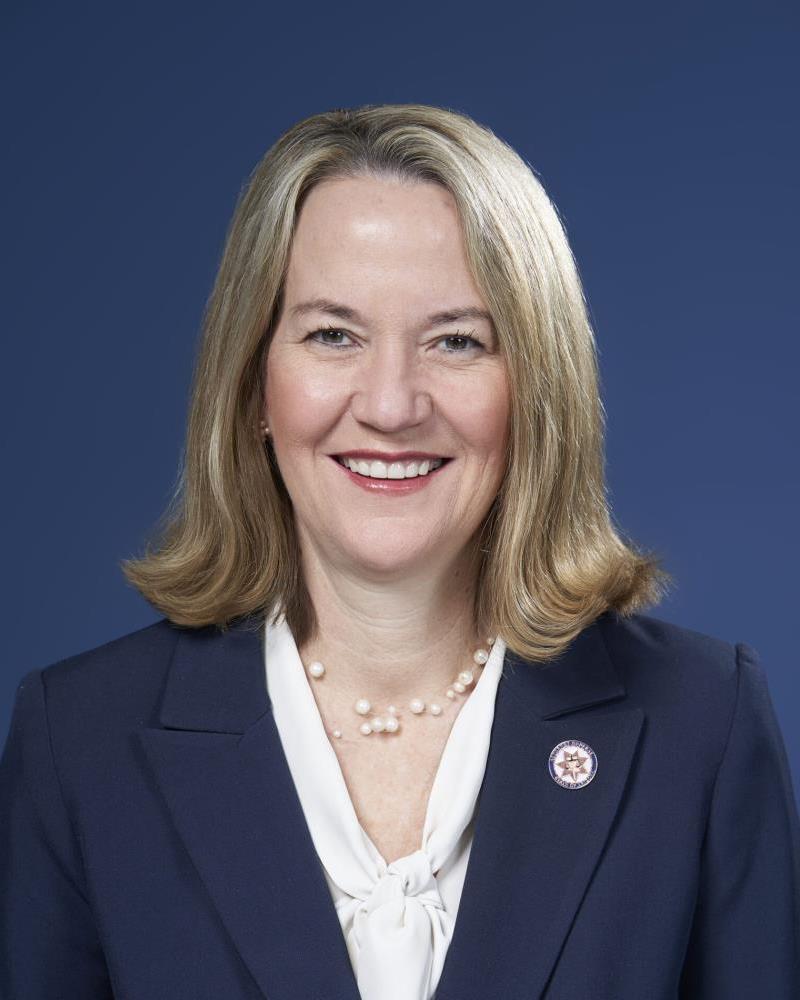
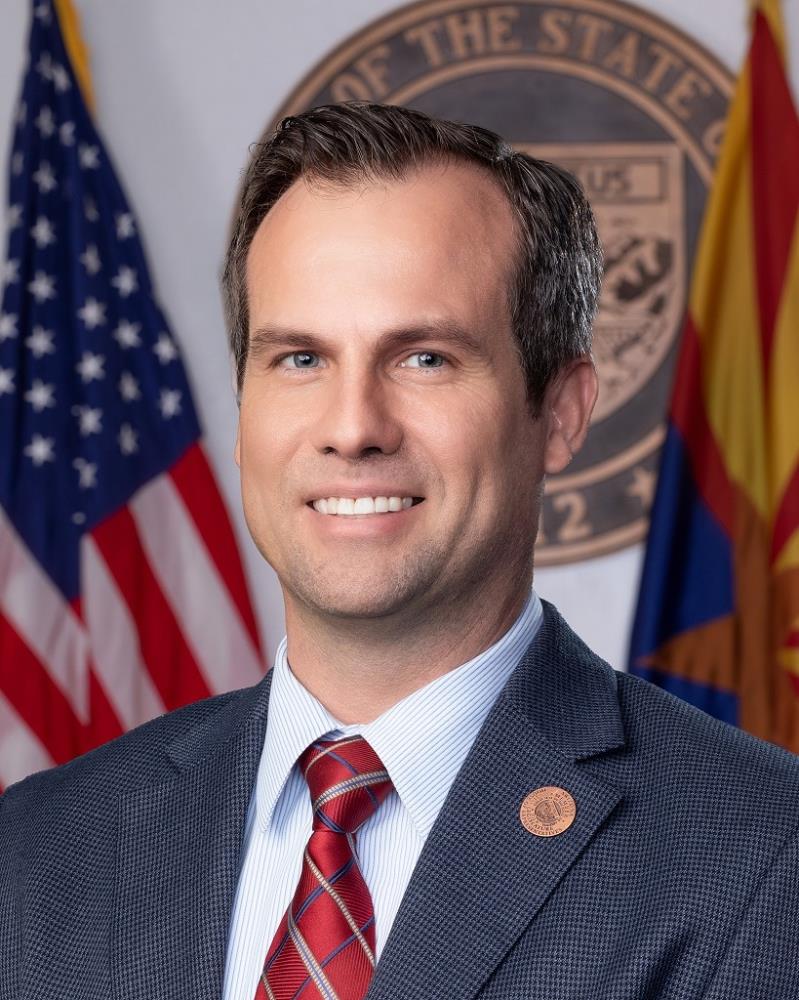



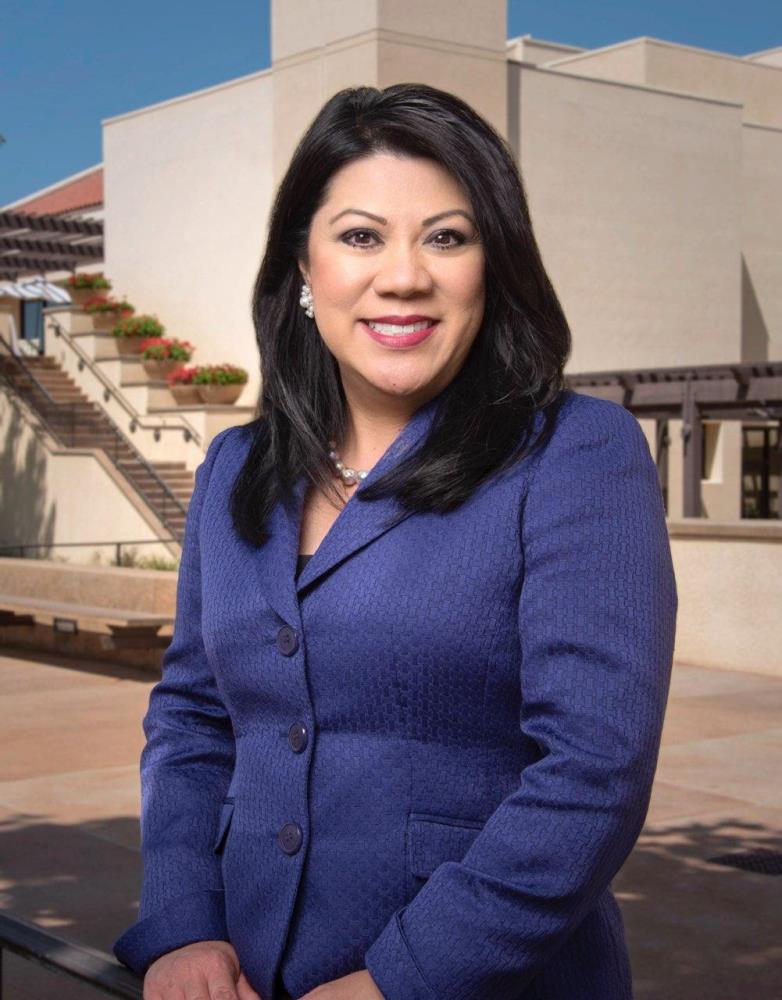


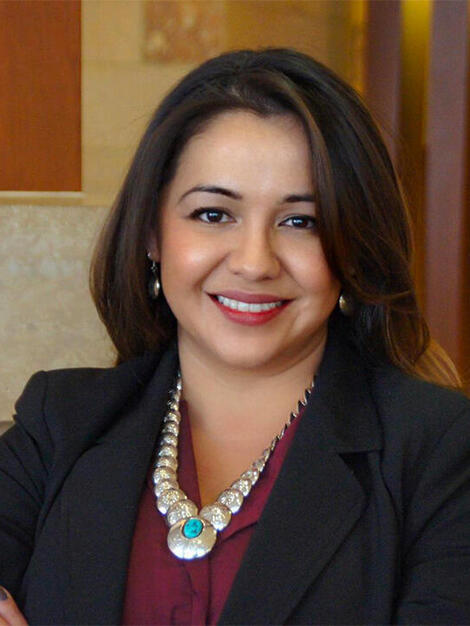


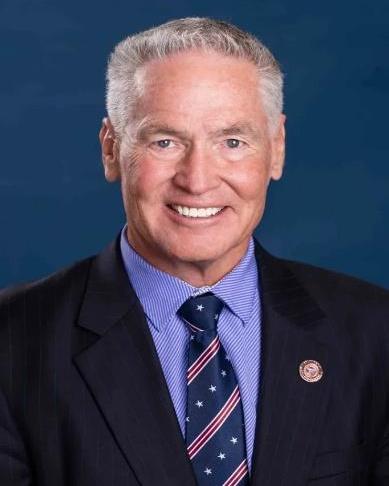















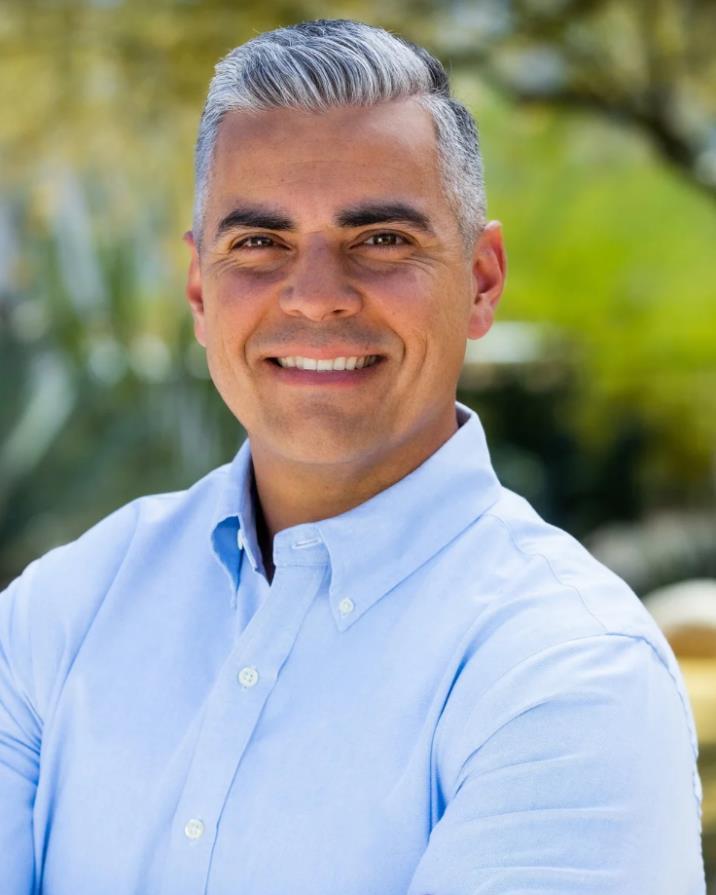







"Counted" here is an estimate, from each county's progress in the governor's race, because no one publishes a legislative district's expected vote. Names are who we expect to win, with their chance. Open a district for every candidate.
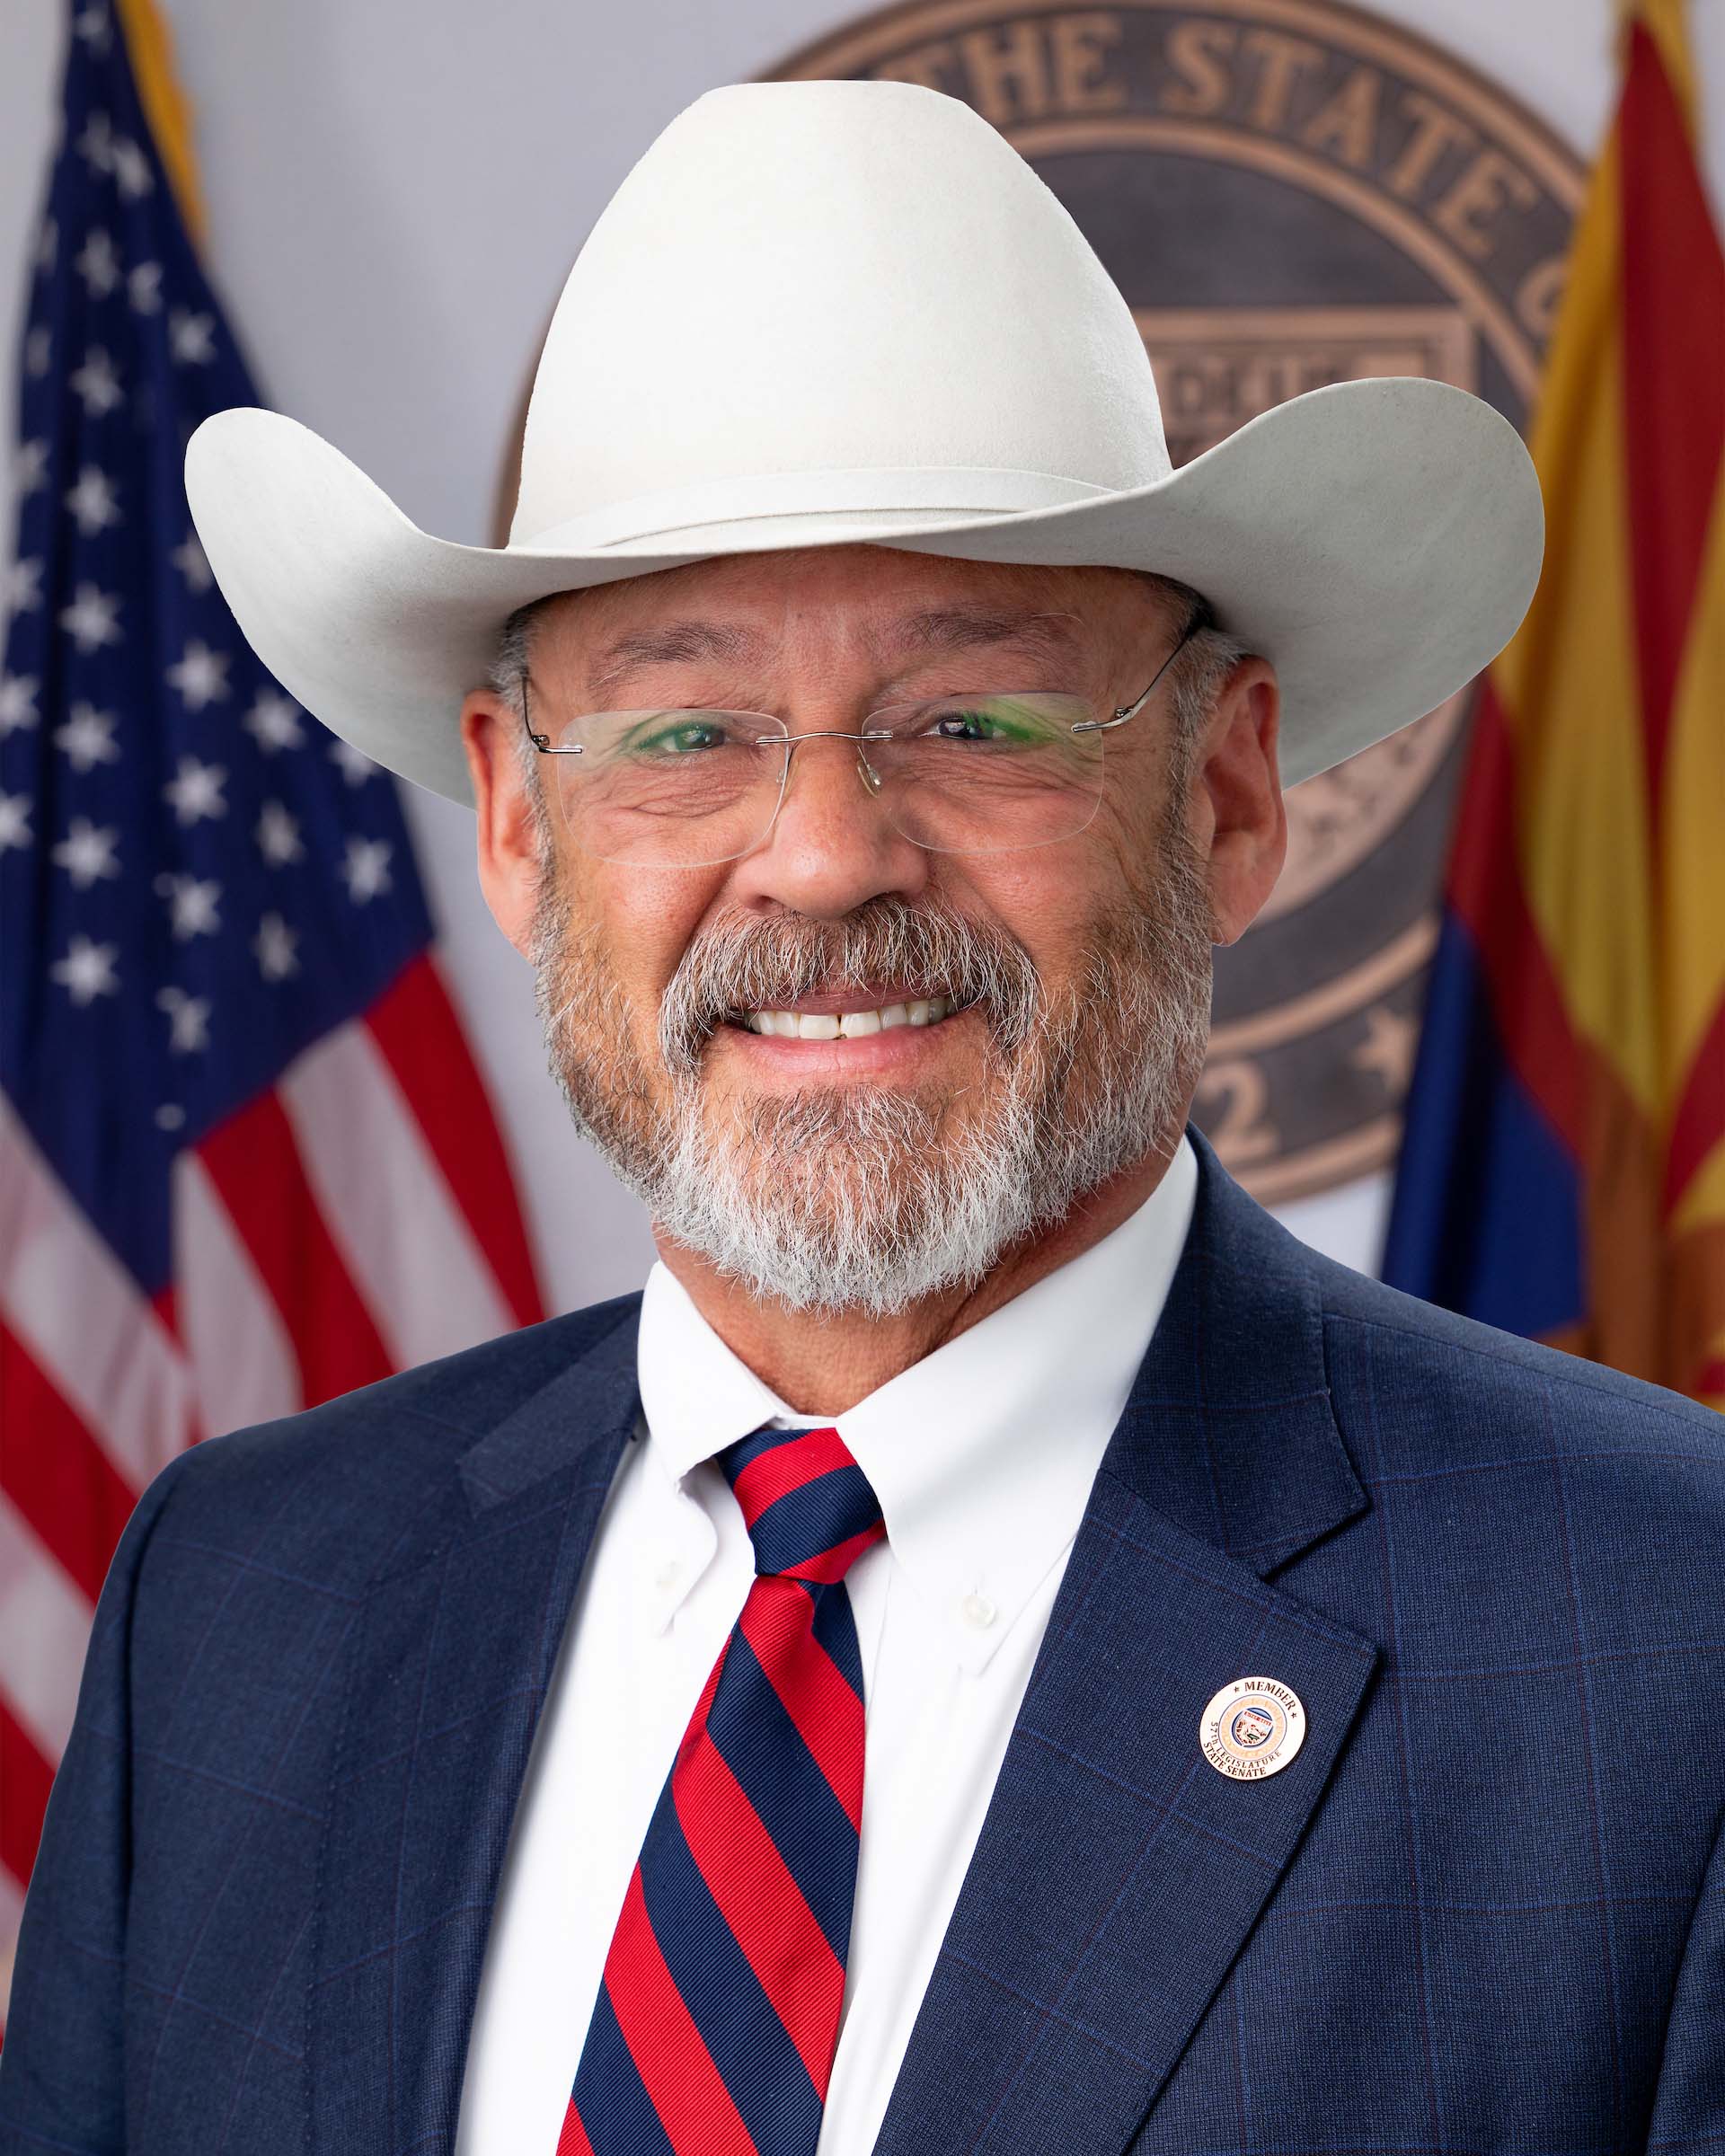 Finchem >99%
House
 Bliss >99%
 Nguyen >99%
90%counted
District 1: full page, with projections and counties


 Gallitano >99%
House
 Simacek >99%
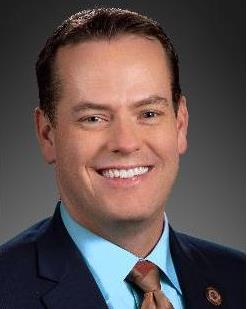 Wilmeth >99%
82%counted
District 2: full page, with projections and counties
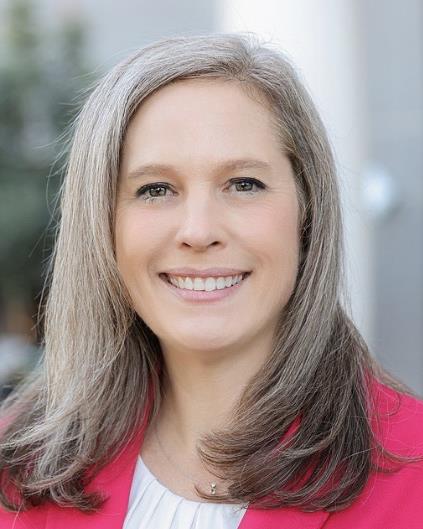

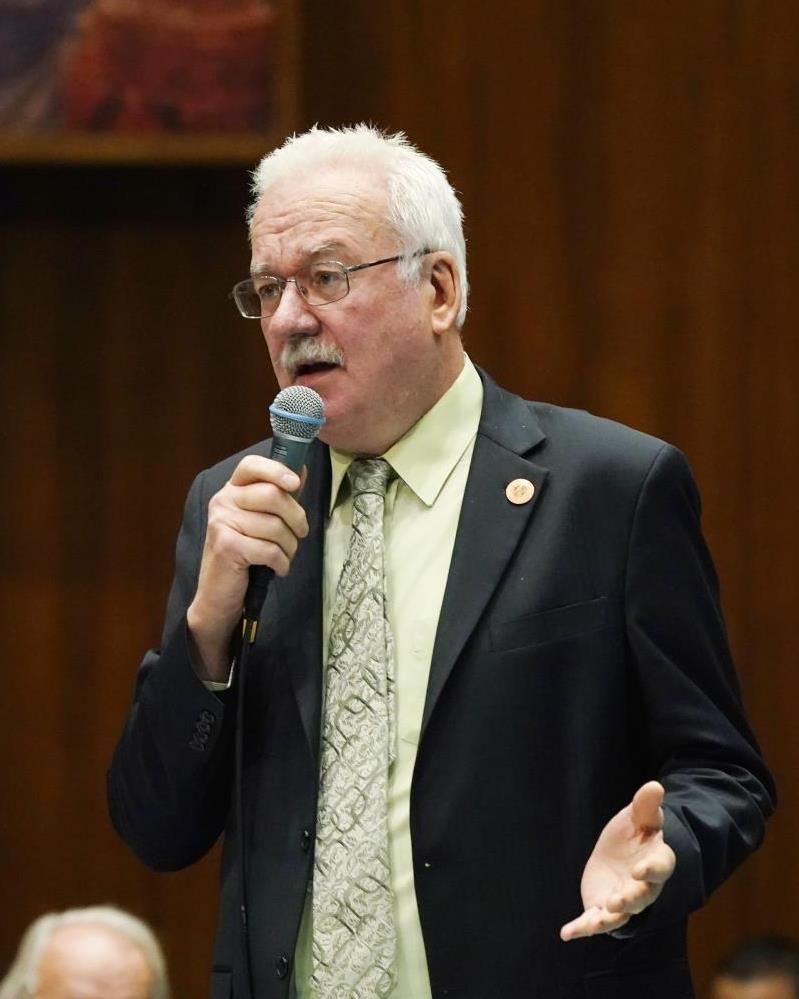 Kavanagh >99%
House
 Reim >99%
 Khalaf >99%
82%counted
District 3: full page, with projections and counties




 Lieberman 99%
House
 Caputi 97%
 Gresham 93%
82%counted
District 4: full page, with projections and counties



 Marsh >99%
House
 Liguori >99%
 Márquez >99%
82%counted
District 5: full page, with projections and counties

 Peshlakai >99%
House
 Peshlakai >99%
 Teller >99%
84%counted
District 6: full page, with projections and counties


 Rogers >99%
House
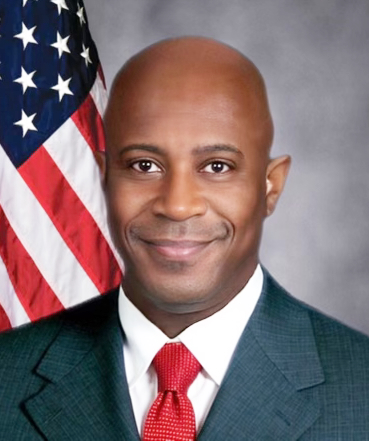 Blackman >99%
 Cook >99%
85%counted
District 7: full page, with projections and counties



 Kuby >99%
House
 Connolly >99%
 Garcia >99%
82%counted
District 8: full page, with projections and counties


 Sears >99%
House
 Austin >99%
 Martinez >99%
82%counted
District 9: full page, with projections and counties


 Farnsworth >99%
House
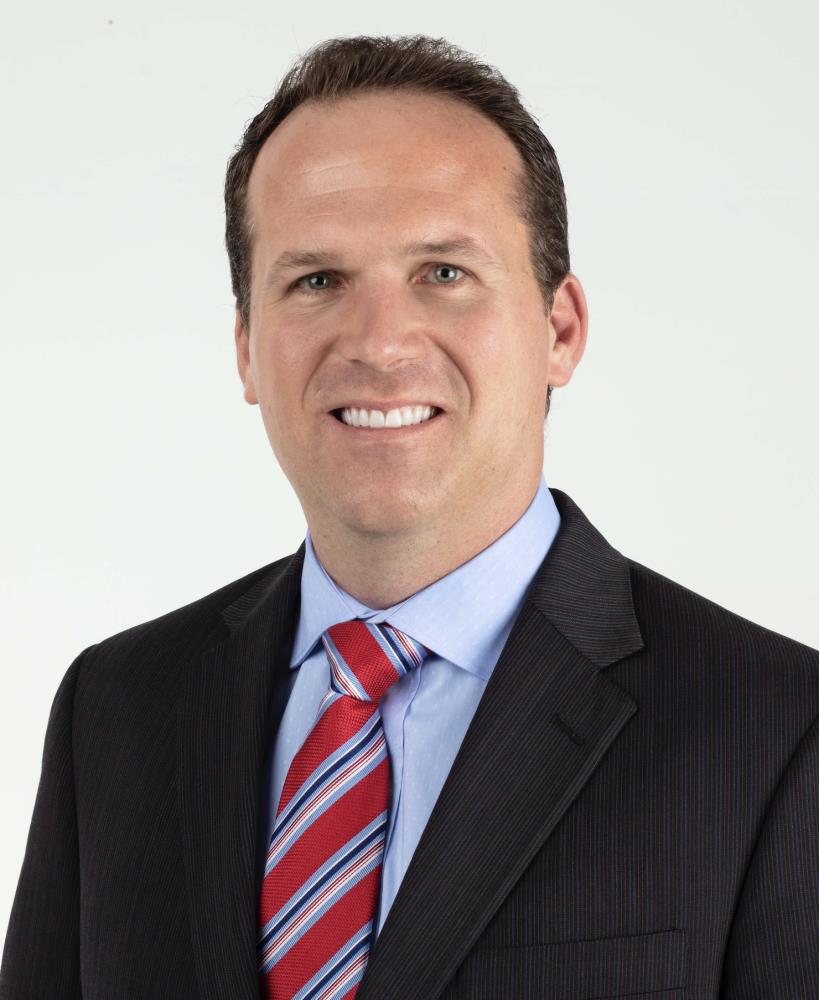 Olson >99%
 Rogers >99%
82%counted
District 10: full page, with projections and counties
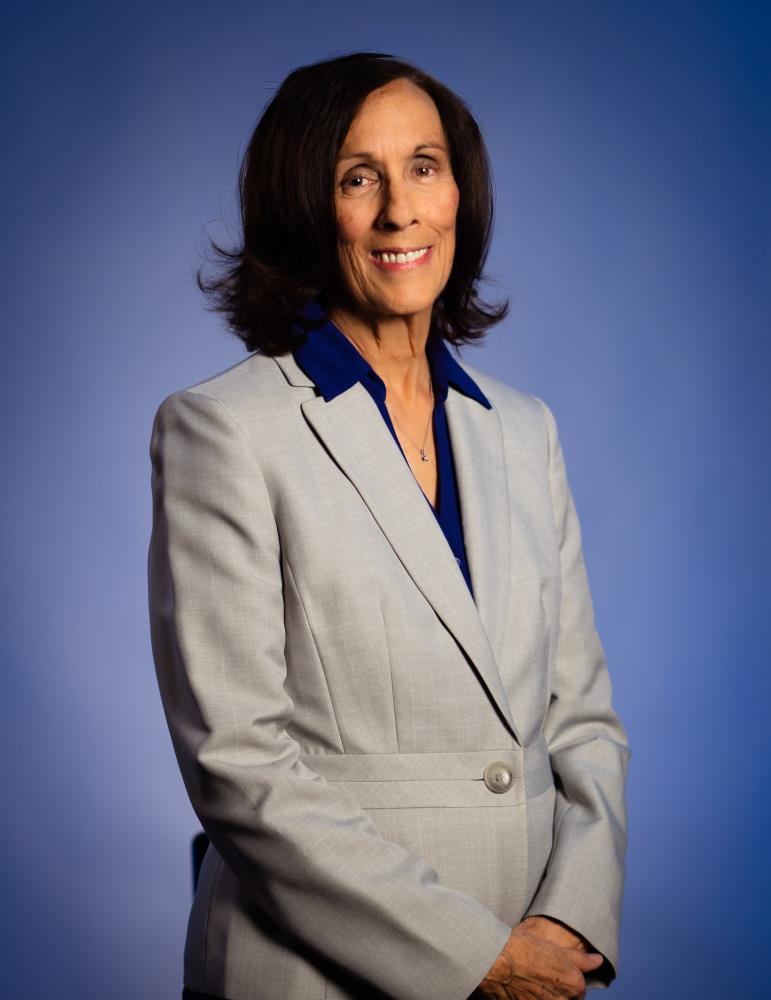




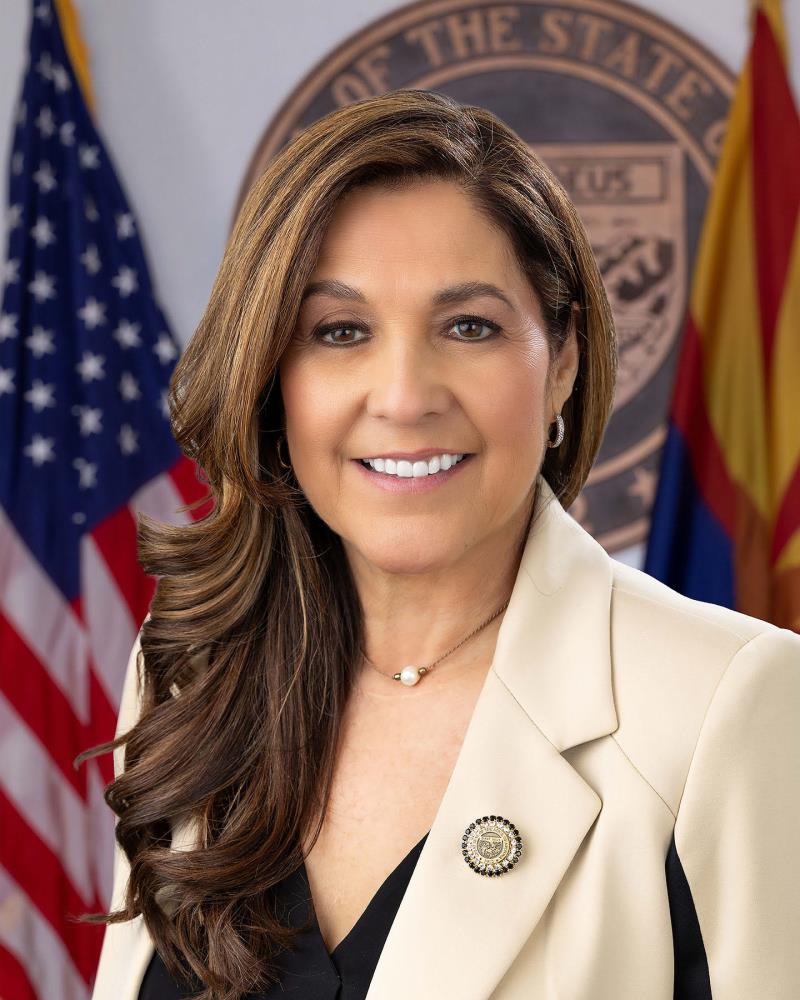 Miranda >99%
House
 Santos >99%
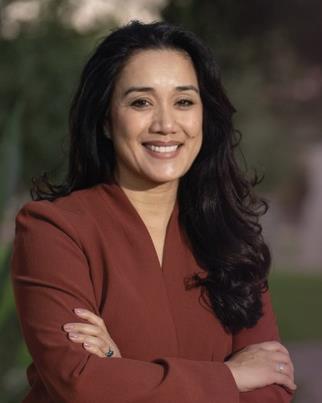 Cavero >99%
82%counted
District 11: full page, with projections and counties



 Contreras >99%
House
 Travers >99%
 Montero >99%
82%counted
District 12: full page, with projections and counties


 O'Brien >99%
House
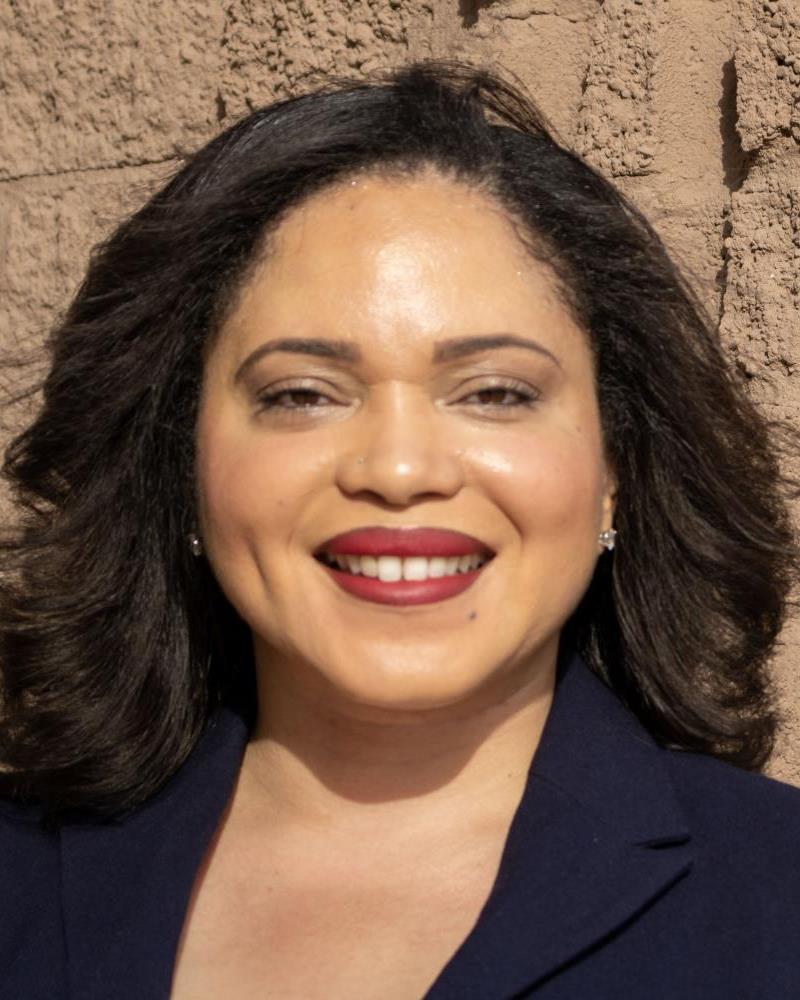 Armstrong >99%
 Weinberg 98%
82%counted
District 13: full page, with projections and counties



 Walsh 84%
House
 Rose 95%
 Farnsworth >99%
82%counted
District 14: full page, with projections and counties


 Hoffman >99%
House
 Carter >99%
 Way >99%
87%counted
District 15: full page, with projections and counties

 Aldrete 98%
House
 Gusse >99%
 Martinez >99%
91%counted
District 16: full page, with projections and counties

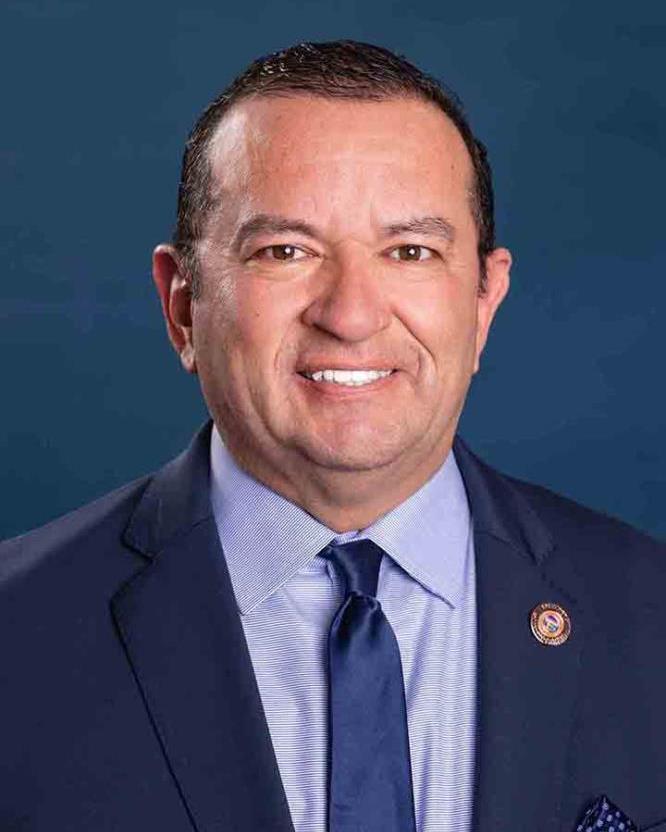
 Soto >99%
House
 Volk >99%
 Lyon >99%
80%counted
District 17: full page, with projections and counties


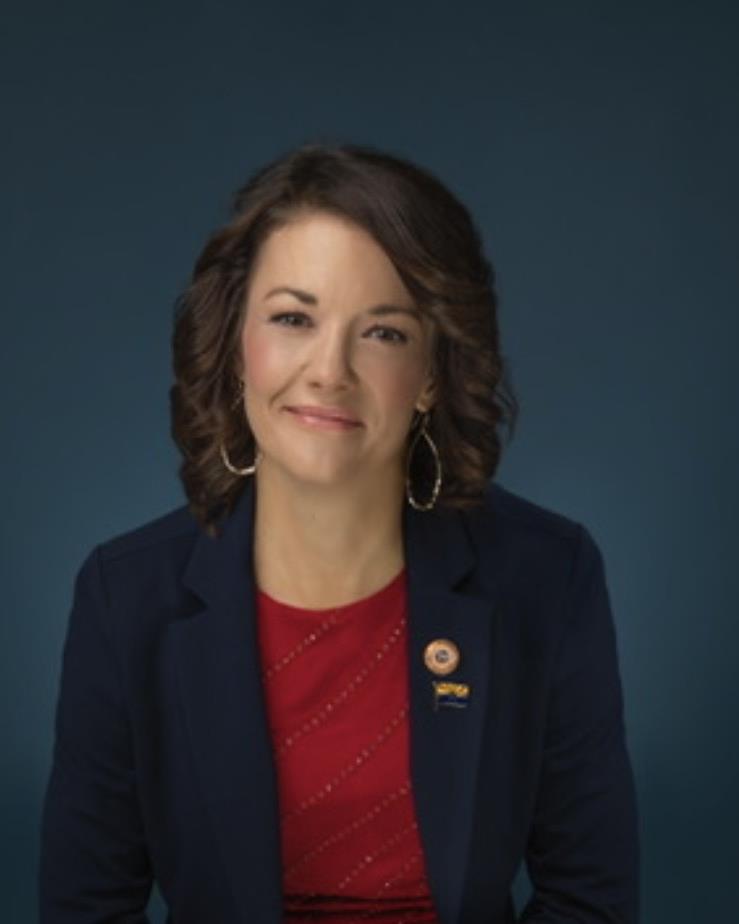
 Sundareshan >99%
House
 Gutierrez >99%
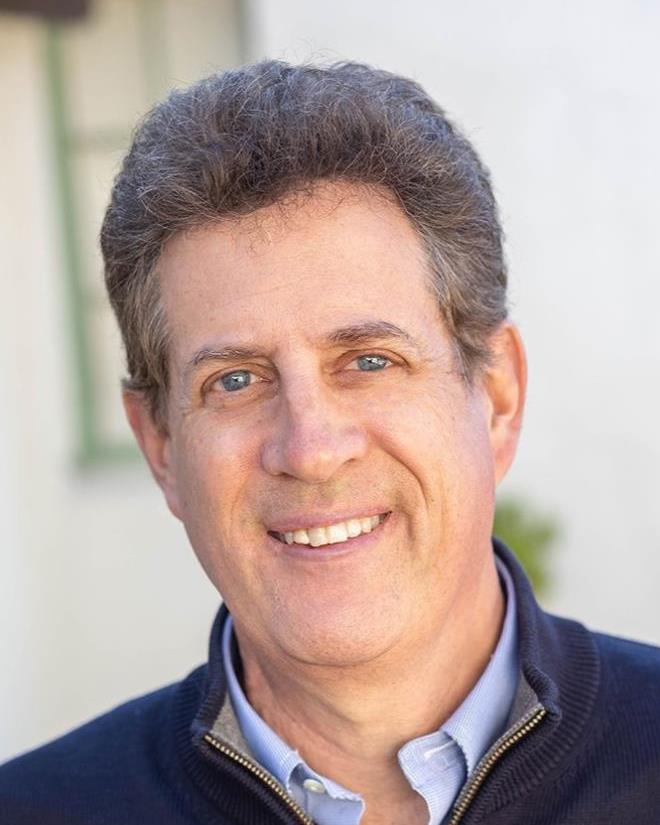 Mathis >99%
79%counted
District 18: full page, with projections and counties


 Griffin >99%
House
 Gowan >99%
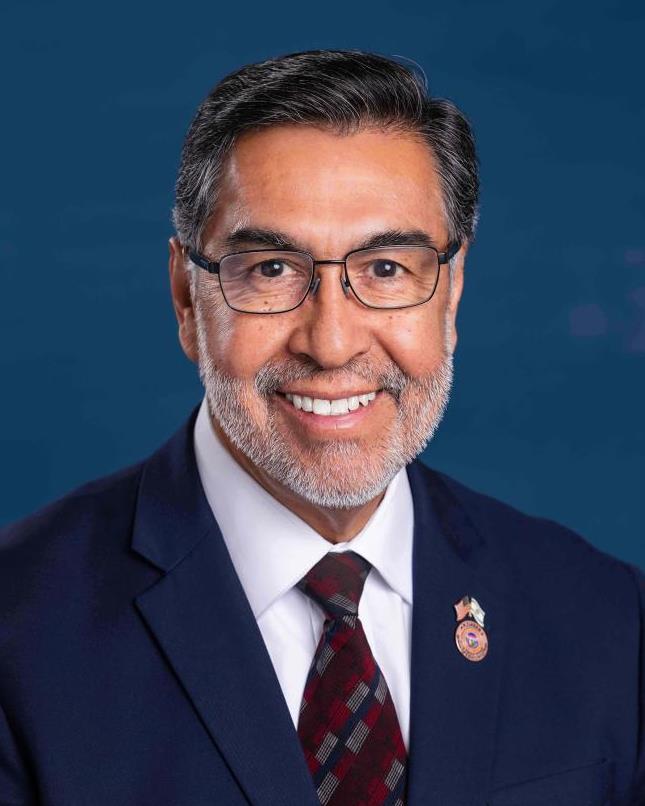 Diaz >99%
82%counted
District 19: full page, with projections and counties



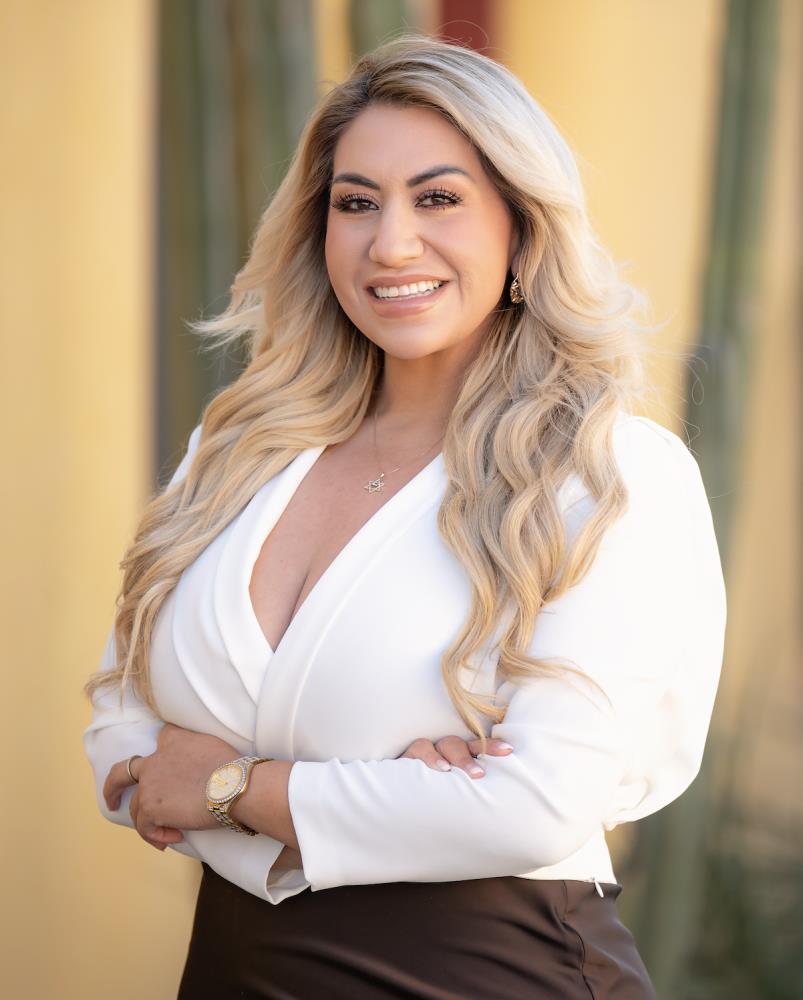 Hernandez >99%
House
 Gonzales >99%
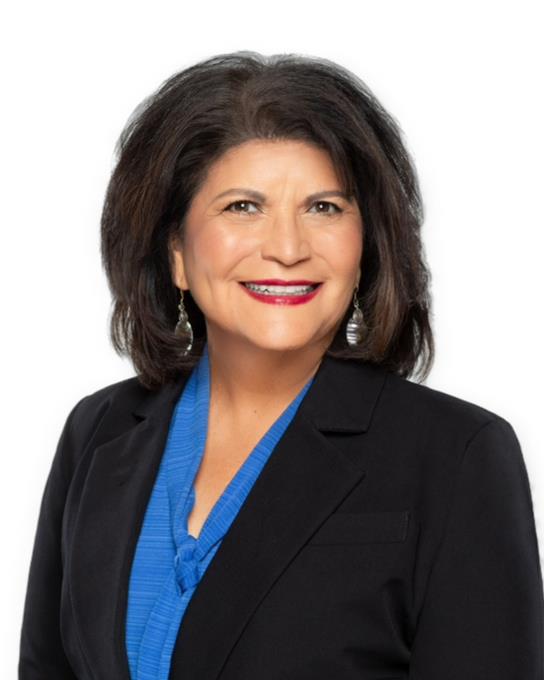 Villegas >99%
79%counted
District 20: full page, with projections and counties
 Gabaldón >99%
House
 Lopez >99%
 Hernandez >99%
81%counted
District 21: full page, with projections and counties


 Diaz >99%
House
 Munoz >99%
 Luna-Nájera >99%
82%counted
District 22: full page, with projections and counties
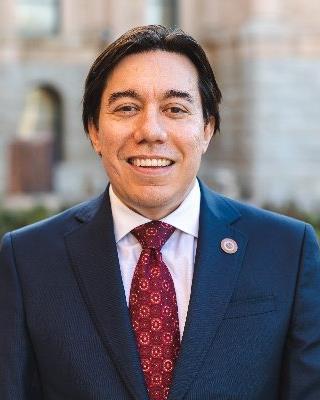 Fernandez >99%
House
 Sandoval >99%
 Cortez >99%
74%counted
District 23: full page, with projections and counties


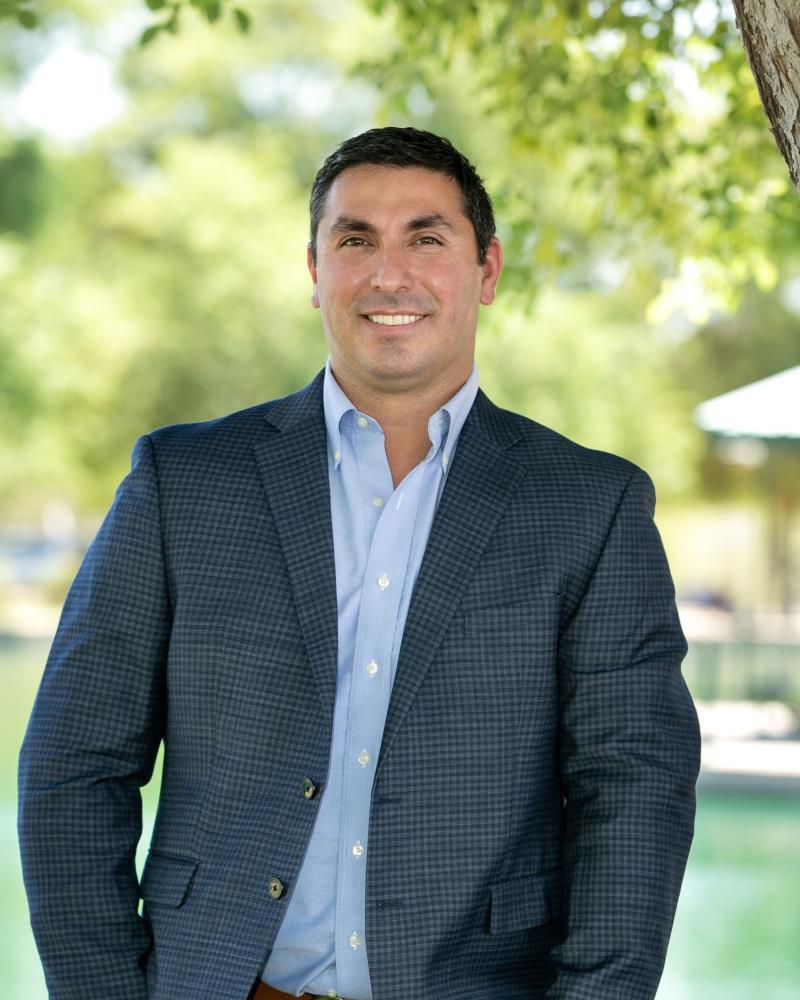
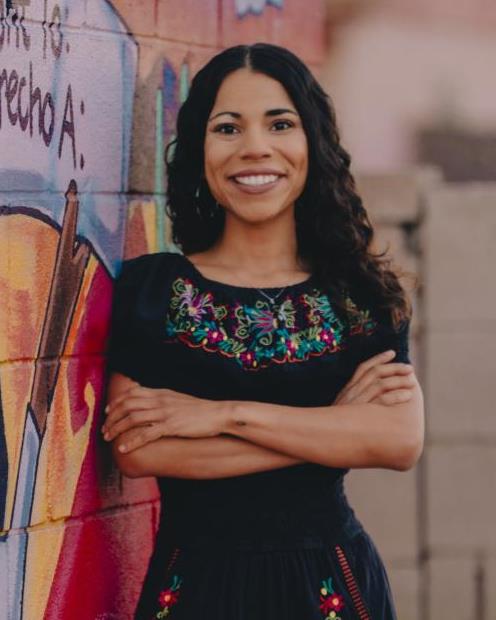 Ortiz >99%
House
 Flores >99%
 Arescurenaga >99%
82%counted
District 24: full page, with projections and counties
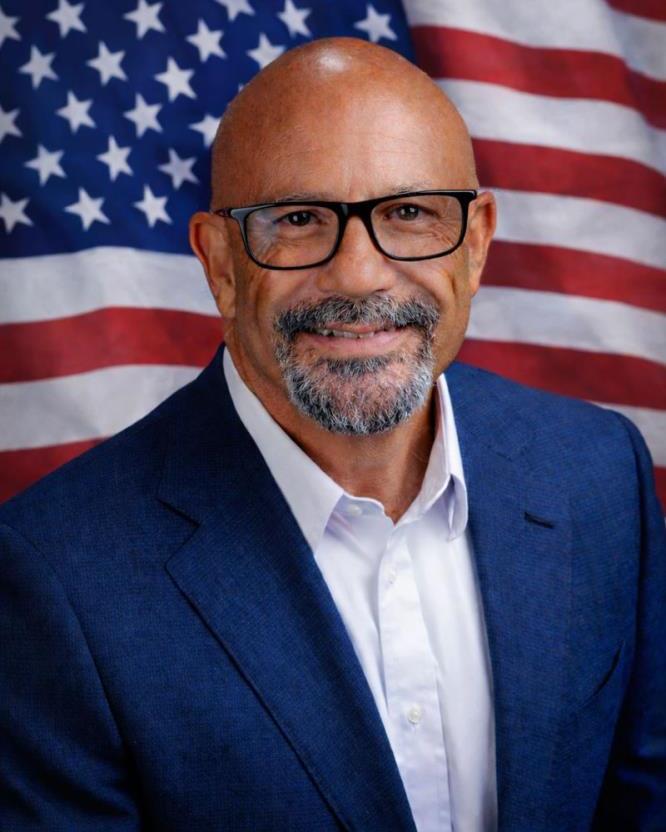

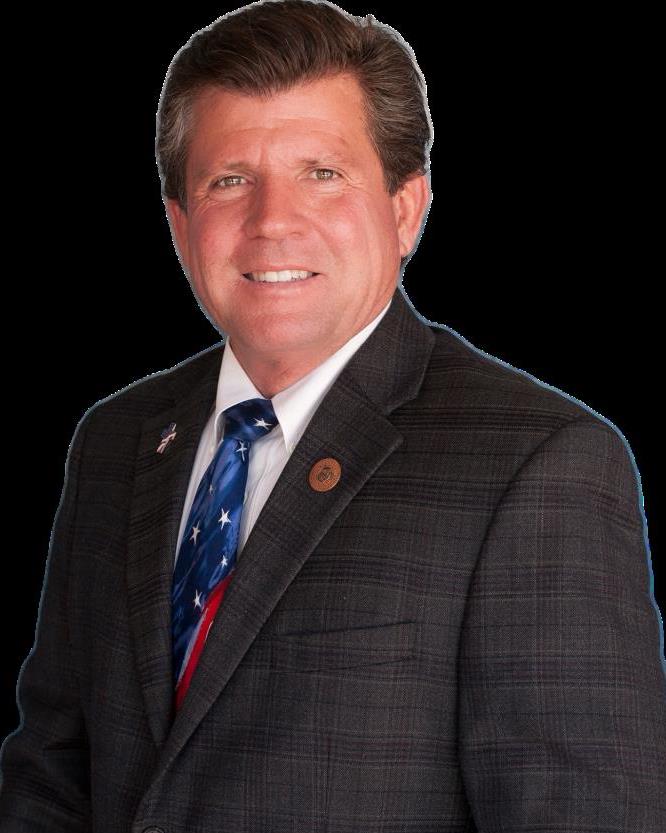 Dunn >99%
House
 Carbone >99%
 Kupper 95%
76%counted
District 25: full page, with projections and counties


 Bravo >99%
House
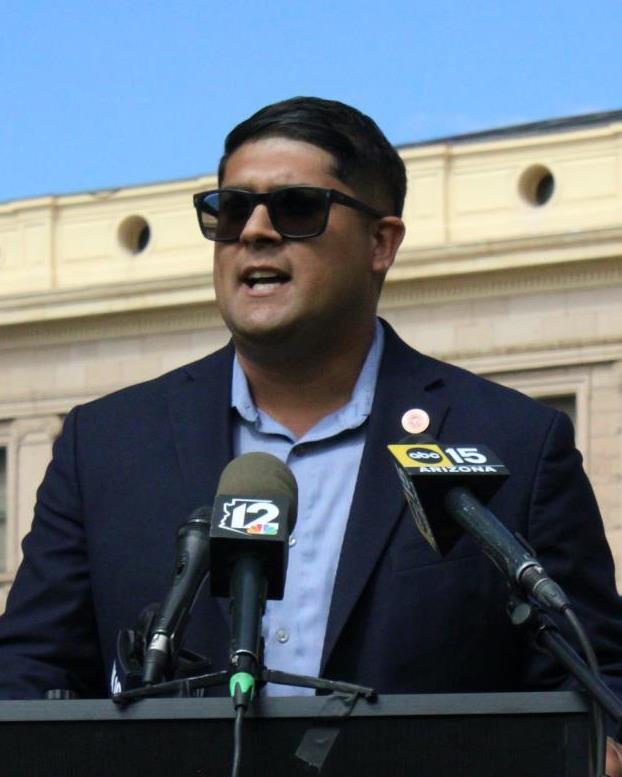 Aguilar >99%
 Crews >99%
82%counted
District 26: full page, with projections and counties



 Clayton 96%
House
 Howard >99%
 Fink 85%
82%counted
District 27: full page, with projections and counties


 Carroll >99%
House
 Livingston >99%
 Pingerelli >99%
82%counted
District 28: full page, with projections and counties



 Shamp 96%
House
 Scianna 74%
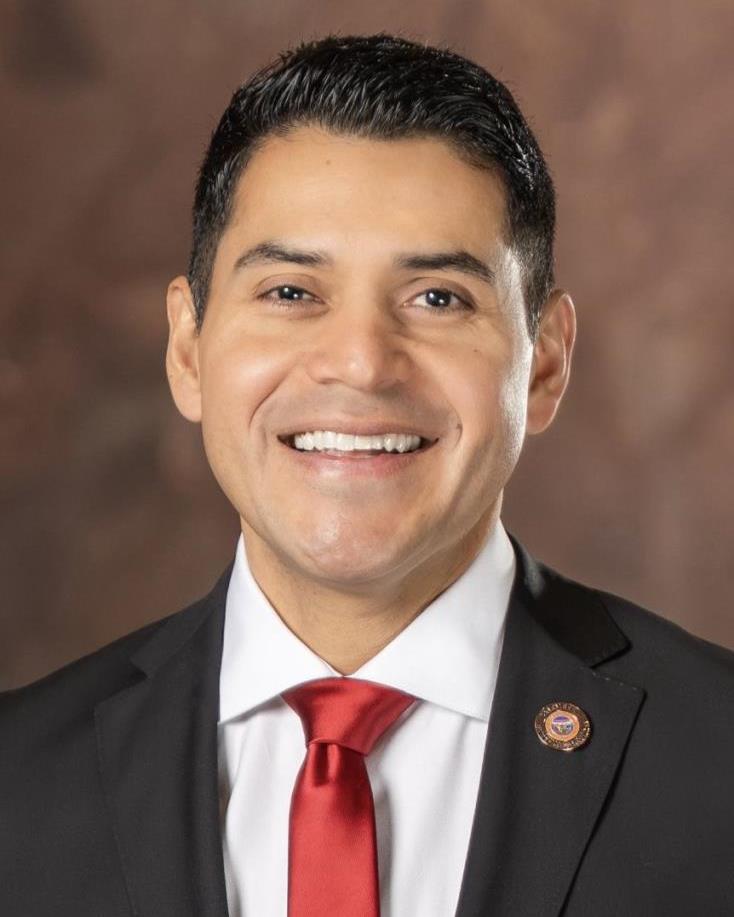 Montenegro >99%
82%counted
District 29: full page, with projections and counties


 Biasiucci >99%
House
 Gannuscio >99%
 Rose >99%
85%counted
District 30: full page, with projections and counties

How far each legislative district has moved since the same contest in 2024 or 2022. Comparisons are withheld when a major party was missing from either ballot or a party ran a different number of House candidates.
Would add a section to the Arizona Constitution that bars taxes or fees based on vehicle miles traveled and bars laws or rules that monitor or limit vehicle miles traveled without consent. Certain interstate commercial vehicles and vehicles owned by the state or local governments are not covered.
Expected to finish ahead: Yes 83% chance
Would add detail to the Arizona Constitution's existing ban on preferential treatment or discrimination by the state based on race, ethnicity or other classes. It would specifically prohibit requiring support for race-based preferences or diversity statements as a condition of education, employment or contracts, spending public money on certain education positions, and certain disciplinary practices, with exceptions for health services, legal and other reasons.
Expected to finish ahead: No >99% chance
Would amend the Arizona Constitution to require all voters, including by-mail voters, to show government-issued ID in each election, and to give every voter the option of having their ballot tabulated at their voting location on election day. It would also bar foreign nationals from contributing to or spending on Arizona elections, set a new standard for judicial review of election laws, and require the legislature to fund these provisions.
Expected to finish ahead: No >99% chance
Would bar local governments from adopting or increasing a tax on groceries from July 1, 2025 through June 30, 2027 (retroactive), and after that bar new or increased grocery taxes without voter approval, capped at a 2% rate.
Expected to finish ahead: Yes >99% chance
Would declare drug cartels to be terrorist organizations and direct the Arizona Department of Homeland Security to do everything in its authority to address threats from drug cartels. It defines 'drug cartel' as an association of persons engaged in human smuggling, drug trafficking or acts defined as terrorism under Arizona law, and says it does not support an asylum claim.
Expected to finish ahead: Yes >99% chance
Would require all schools (public and private) and athletic associations to designate athletic teams as male, female or coed based on biological sex recorded at birth, and bar them from authorizing use of private spaces such as restrooms not designated for a person's sex. It defines 'sex' by the original birth certificate and lets athletes sue schools and associations that knowingly violate it.
Expected to finish ahead: Yes >99% chance
Would bar state agencies and local governments from using photo enforcement systems to identify traffic-law violators unless they have a contract to use them by December 31, 2026. Local governments would need voter approval of existing systems at the next regular general election and every 10 years afterward.
Expected to finish ahead: Yes >99% chance
Would require school districts with 7,500 or more students, or operating in a county of 500,000 or more people, to spend at least 60% of operational spending on direct instructional expenses as defined by the Auditor General. Non-compliant districts would adjust gradually, and the Department of Education would cut their state Classroom Site Fund money by 25% each year, subject to limited waivers.
Expected to finish ahead: No 93% chance
Unofficial returns only. We show the count and don't call measures, because we haven't checked each one's passage rule.
Arizona voters created the Commission on Judicial Performance Review, mostly public members plus attorneys and judges, to rate judges up for retention. It surveys attorneys, jurors, litigants, witnesses and staff, holds public hearings, and votes on whether each judge meets its standards for legal knowledge, impartiality, communication, temperament and work ethic. All 82 judges it reviewed this year met them, so the survey scores are where they differ.
Meets standards · On the bench since 2023
Furthest below typical: Administration, 87% against 100%.
| Rated acceptable or better | Score | Typical | Responses | |
|---|---|---|---|---|
| Legal ability | 96% | 97% | 37 | |
| Integrity | 94% | 100% | 31 | |
| Communication | 98% | 100% | 22 | |
| Temperament | 93% | 100% | 24 | |
| Administration | 87% | 100% | 31 | |
43 of 180 voluntary surveys returned, February–September 2025, the later of two survey periods. Typical, the gold mark, is the median of the 15 appeals and Supreme Court judges reviewed.
Expected: Retained >99% chance
Meets standards · On the bench since 2023
| Rated acceptable or better | Score | Typical | Responses | |
|---|---|---|---|---|
| Legal ability | 97% | 97% | 27 | |
| Integrity | 100% | 100% | 25 | |
| Communication | 100% | 100% | 20 | |
| Temperament | 100% | 100% | 23 | |
| Administration | 96% | 100% | 25 | |
33 of 136 voluntary surveys returned, February–September 2025, the later of two survey periods. Typical, the gold mark, is the median of the 15 appeals and Supreme Court judges reviewed.
Expected: Retained 69% chance
Meets standards · On the bench since 2023
| Rated acceptable or better | Score | Typical | Responses | |
|---|---|---|---|---|
| Legal ability | 98% | 97% | 33 | |
| Integrity | 97% | 100% | 30 | |
| Communication | 100% | 100% | 18 | |
| Temperament | 100% | 100% | 19 | |
| Administration | 97% | 100% | 31 | |
35 of 138 voluntary surveys returned, February–September 2025, the later of two survey periods. Typical, the gold mark, is the median of the 15 appeals and Supreme Court judges reviewed.
Expected: Retained >99% chance
Meets standards · On the bench since 2018
Furthest below typical: Integrity, 93% against 100%.
| Rated acceptable or better | Score | Typical | Responses | |
|---|---|---|---|---|
| Legal ability | 93% | 97% | 30 | |
| Integrity | 93% | 100% | 27 | |
| Communication | 100% | 100% | 19 | |
| Temperament | 100% | 100% | 19 | |
| Administration | 97% | 100% | 29 | |
32 of 145 voluntary surveys returned, February–September 2025, the later of two survey periods. Typical, the gold mark, is the median of the 15 appeals and Supreme Court judges reviewed.
Expected: Retained >99% chance
Meets standards · On the bench since 2017
At or above the typical judge in every category.
| Rated acceptable or better | Score | Typical | Responses | |
|---|---|---|---|---|
| Legal ability | 100% | 97% | 22 | |
| Integrity | 100% | 100% | 22 | |
| Communication | 100% | 100% | 18 | |
| Temperament | 100% | 100% | 18 | |
| Administration | 100% | 100% | 22 | |
24 of 104 voluntary surveys returned, February–September 2025, the later of two survey periods. Typical, the gold mark, is the median of the 15 appeals and Supreme Court judges reviewed.
Expected: Retained >99% chance
Meets standards · On the bench since 2017
Furthest below typical: Administration, 94% against 100%.
| Rated acceptable or better | Score | Typical | Responses | |
|---|---|---|---|---|
| Legal ability | 94% | 97% | 35 | |
| Integrity | 97% | 100% | 31 | |
| Communication | 100% | 100% | 19 | |
| Temperament | 100% | 100% | 19 | |
| Administration | 94% | 100% | 33 | |
36 of 134 voluntary surveys returned, February–September 2025, the later of two survey periods. Typical, the gold mark, is the median of the 15 appeals and Supreme Court judges reviewed.
Expected: Retained >99% chance
Meets standards · On the bench since 2023
| Rated acceptable or better | Score | Typical | Responses | |
|---|---|---|---|---|
| Legal ability | 97% | 97% | 30 | |
| Integrity | 97% | 100% | 29 | |
| Communication | 100% | 100% | 19 | |
| Temperament | 100% | 100% | 19 | |
| Administration | 97% | 100% | 30 | |
32 of 187 voluntary surveys returned, February–September 2025, the later of two survey periods. Typical, the gold mark, is the median of the 15 appeals and Supreme Court judges reviewed.
Expected: Retained >99% chance
Meets standards · On the bench since 2012
| Rated acceptable or better | Score | Typical | Responses | |
|---|---|---|---|---|
| Legal ability | 100% | 97% | 38 | |
| Integrity | 100% | 100% | 35 | |
| Communication | 99% | 100% | 25 | |
| Temperament | 100% | 100% | 25 | |
| Administration | 97% | 100% | 38 | |
46 of 178 voluntary surveys returned, February–September 2025, the later of two survey periods. Typical, the gold mark, is the median of the 15 appeals and Supreme Court judges reviewed.
Expected: Retained >99% chance
Meets standards · On the bench since 2023
| Rated acceptable or better | Score | Typical | Responses | |
|---|---|---|---|---|
| Legal ability | 94% | 97% | 18 | |
| Integrity | 100% | 100% | 16 | |
| Communication | 100% | 100% | 11 | |
| Temperament | 100% | 100% | 11 | |
| Administration | 100% | 100% | 14 | |
22 of 102 voluntary surveys returned, February–September 2025, the later of two survey periods. Typical, the gold mark, is the median of the 15 appeals and Supreme Court judges reviewed.
Expected: Retained >99% chance
Meets standards · On the bench since 2022
At or above the typical judge in every category.
| Rated acceptable or better | Score | Typical | Responses | |
|---|---|---|---|---|
| Legal ability | 100% | 97% | 21 | |
| Integrity | 100% | 100% | 18 | |
| Communication | 100% | 100% | 14 | |
| Temperament | 100% | 100% | 14 | |
| Administration | 100% | 100% | 17 | |
28 of 160 voluntary surveys returned, February–September 2025, the later of two survey periods. Typical, the gold mark, is the median of the 15 appeals and Supreme Court judges reviewed.
Expected: Retained >99% chance
Meets standards · On the bench since 2017
At or above the typical judge in every category.
| Rated acceptable or better | Score | Typical | Responses | |
|---|---|---|---|---|
| Legal ability | 100% | 97% | 11 | |
| Integrity | 100% | 100% | 11 | |
| Communication | 100% | 100% | 9 | |
| Temperament | 100% | 100% | 9 | |
| Administration | 100% | 100% | 11 | |
13 of 89 voluntary surveys returned, February–September 2025, the later of two survey periods. Typical, the gold mark, is the median of the 15 appeals and Supreme Court judges reviewed.
Expected: Retained >99% chance
Meets standards · On the bench since 2023
Furthest below typical: Legal ability, 90% against 97%.
| Rated acceptable or better | Score | Typical | Responses | |
|---|---|---|---|---|
| Legal ability | 90% | 97% | 26 | |
| Integrity | 95% | 100% | 22 | |
| Communication | 93% | 100% | 11 | |
| Temperament | 91% | 100% | 11 | |
| Administration | 100% | 100% | 25 | |
31 of 141 voluntary surveys returned, February–September 2025, the later of two survey periods. Typical, the gold mark, is the median of the 15 appeals and Supreme Court judges reviewed.
Expected: Retained >99% chance
Meets standards · On the bench since 2023
| Rated acceptable or better | Score | Typical | Responses | |
|---|---|---|---|---|
| Legal ability | 100% | 97% | 11 | |
| Integrity | 100% | 100% | 11 | |
| Communication | 85% | 100% | 10 | |
| Temperament | 94% | 100% | 10 | |
| Administration | 100% | 100% | 11 | |
15 of 114 voluntary surveys returned, February–September 2025, the later of two survey periods. Typical, the gold mark, is the median of the 15 appeals and Supreme Court judges reviewed.
Expected: Retained >99% chance
Meets standards · On the bench since 2017
| Rated acceptable or better | Score | Typical | Responses | |
|---|---|---|---|---|
| Legal ability | 88% | 97% | 16 | |
| Integrity | 93% | 100% | 14 | |
| Communication | 100% | 100% | 11 | |
| Temperament | 100% | 100% | 11 | |
| Administration | 100% | 100% | 14 | |
20 of 94 voluntary surveys returned, February–September 2025, the later of two survey periods. Typical, the gold mark, is the median of the 15 appeals and Supreme Court judges reviewed.
Expected: Retained >99% chance
Meets standards · On the bench since 2017
At or above the typical judge in every category.
| Rated acceptable or better | Score | Typical | Responses | |
|---|---|---|---|---|
| Legal ability | 100% | 97% | 15 | |
| Integrity | 100% | 100% | 15 | |
| Communication | 100% | 100% | 19 | |
| Temperament | 100% | 100% | 20 | |
| Administration | 100% | 100% | 12 | |
26 of 127 voluntary surveys returned, February–September 2025, the later of two survey periods. Typical, the gold mark, is the median of the 15 appeals and Supreme Court judges reviewed.
Expected: Retained >99% chance
Maricopa County: Every contest on the county's ballot: judges, cities, schools and local measures.
Official sources: Arizona Clean Elections; Independent Redistricting Commission maps; Arizona Legislature; Secretary of State: ballot measures; Arizona Secretary of State. Candidate photos remain their owners' work. Totals for offices where voters choose two count candidate selections, not ballots. Official results posted Nov 5, 5:45 PM.