U.S. Senate
Ken Paxton
75.0%23,232
James Talarico
22.7%7,042
Ted Brown
2.3%698
Statewide: James Talarico wins. Called.
 Electoral MeridianIndependent Election Research
Forecasts. Results. Evidence.
2026 election results. Greg Abbott (R) has 77% of the vote for governor in Wise County, with about 98% of the expected vote counted. The margin is 14.5 points more Democratic than the 2024 presidential vote here. Wise County is split between 2 U.S. House districts.
Statewide: James Talarico wins. Called.
Statewide: Gina Hinojosa wins. Called.

Only part of Wise County is in this district; these are that part's votes. Whole district: Ronny Jackson wins. Called.
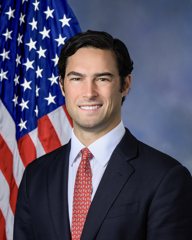
Only part of Wise County is in this district; these are that part's votes. Whole district: Brandon Gill wins. Called.
The leader in Wise County is only who has the most votes counted here. Races are won statewide or district-wide, and only the race pages report calls. Last vote update here Nov 3, 11:20 PM.
| Race | Margin | 2024 president | Shift |
|---|---|---|---|
| TX Senate | R +53.5 | R +70.5 | D +17.0 |
| TX Governor | R +56.0 | R +70.5 | D +14.5 |
| TX-13 part of the county | R +69.3 | R +76.9 | D +7.6 |
| TX-26 part of the county | R +57.0 | R +69.1 | D +12.2 |
Margins compare the Democrat and the Republican only. The 2024 column is the presidential margin in the same places as each race's votes here. Shift is this year's margin minus it, shown once at least 90% of the expected vote is counted. A dash means there's no 2024 figure for those exact places.
| Year | Democrat | Share | Republican | Share | Margin |
|---|---|---|---|---|---|
| 2024 | Kamala Harris | 14.7% | Donald Trump | 84.8% | R +70.1 |
| 2020 | Joe Biden | 15.4% | Donald Trump | 83.5% | R +68.2 |
| 2016 | Hillary Clinton | 13.8% | Donald Trump | 83.4% | R +69.7 |
| 2012 | Barack Obama | 15.5% | Mitt Romney | 82.9% | R +67.4 |
| 2008 | Barack Obama | 21.7% | John McCain | 77.4% | R +55.7 |
| 2004 | John Kerry | 23.9% | George W. Bush | 75.8% | R +51.9 |
| 2000 | Al Gore | 29.5% | George W. Bush | 68.6% | R +39.1 |
Shares are of all presidential votes, and the margin is the Democrat's share minus the Republican's. Since 2000, the presidential margin here has moved R +31.0.
Votes for 2026 come from the count this site reads, by county. They're unofficial until Texas certifies them. Past presidential votes are from MEDSL and VEST, via Polling Forecast. Texas's own results, deadlines and offices are on the state page.