Posts going around say the 2026 election was rigged or stolen. Each claim below is checked against the counted votes: the states' own result files where we read them, the national count everywhere else, and official results back to 1976. 9 of the 10 claims checked here don't hold up as evidence of fraud; 1 has something that needs a closer look, and the check says what.
Donald Trump's own posts claiming fraud are checked every day on their own page.
All 2026 figures are unofficial until states certify, and they move as counting goes on, so this page updates with the count. Totals like these can't show whether a single vote was switched. Only checks of the paper ballots, such as audits and recounts, can, and that's where real evidence of fraud would turn up. What totals can show is whether a claim's numbers and reasoning hold up. The posts and the people who made them aren't named here; their figures are quoted as they appear.
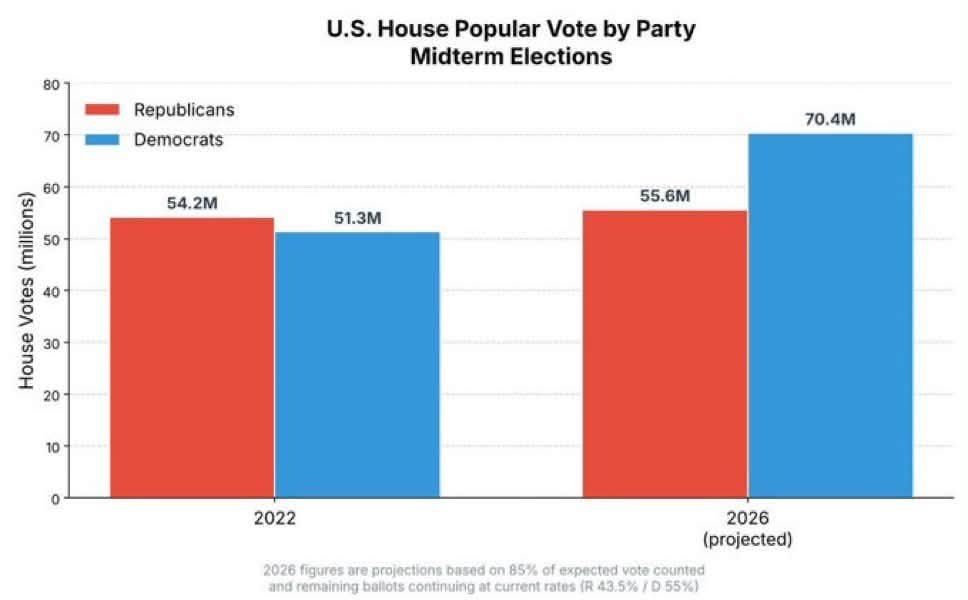
The claim: Republicans turned out as if it were a primary, and Democrats' House vote can't be real. A chart projects 70.4 million Democratic votes to 55.6 million Republican, against 51.3 million to 54.2 million in 2022.
What the post showed, cropped to its chart or table. Select it to see it full size.
No sign of fraud: a big swing, but a bigger one happened from 2014 to 2018
With about 96% counted, Democratic House candidates have 65.7 million votes and Republicans 49.9 million. Since 2022, Democrats are up 14.1 million and Republicans down 4.5 million.
The post's 2022 figures are close to the official ones: 51.6 million Democratic and 54.4 million Republican.
A bigger rise has happened before: from 2014 to 2018 the Democratic House vote grew by 25.0 million.
The post's 2026 figures are its own projection from 85% counted, so they aren't checked here; this count is still coming in. House totals also depend on which races are contested, so they move between years for reasons that aren't about turnout alone.
How many votes did each party's House candidates get, nationwide?
DemocraticRepublican
Each pair of bars is one election, Democratic on the left. Presidential years draw more voters than midterms, so compare a midterm with other midterms. 2026 is the count so far.
Change since the same kind of election
How much did each party gain or lose against the election four years before?
DemocraticRepublican
Each pair compares an election with the one four years before: midterm with midterm, presidential year with presidential year. Above the line is a gain, below a loss. Switch between votes and percent; a percent change is against the party's own vote four years before.
Share of the two-party House vote
What share of the votes for the two parties' candidates did each party get?
DemocraticRepublican
A party's share doesn't depend on how many people voted, so it compares fairly across years with different turnout.
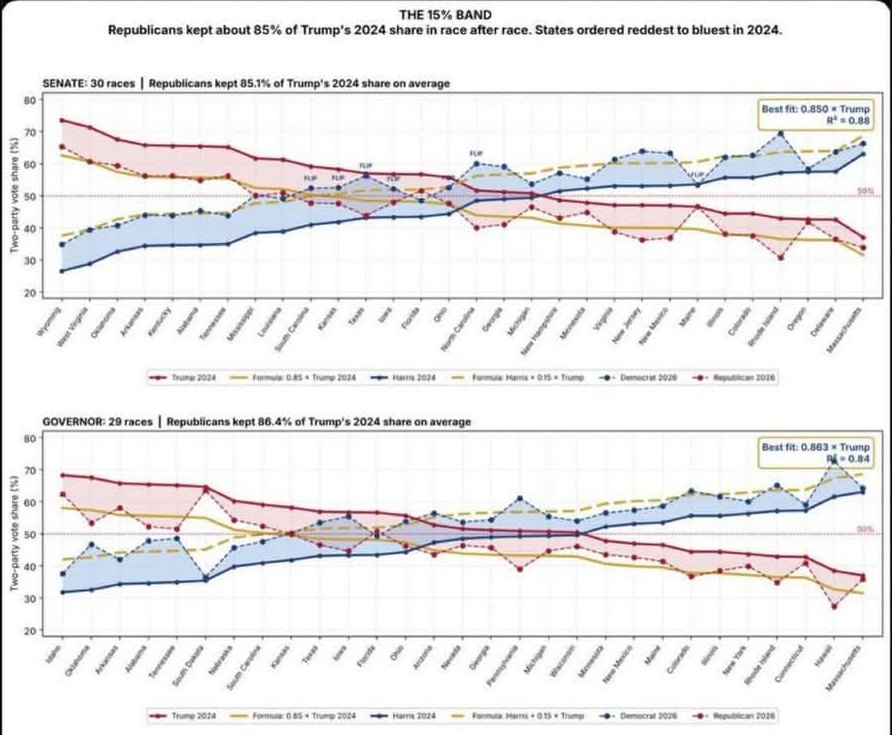
The claim: Republicans kept about 85% of Trump's 2024 share in race after race, which shows an algorithm moved 15% of Trump's votes to Democrats, and any state where Trump got under about 58.5% flipped.
What the post showed, cropped to its chart or table. Select it to see it full size.
No sign of fraud: the formula gets 3 called races wrong, and the same kind of band shows up in 2018 and 2022
This year's 64 Senate and governor races with one Democrat and one Republican: in about eight of ten, the Republican share of the two-party vote was between 78% and 97% of Trump's 2024 share in the same state, with a middle of 86%. That's a band, not a fixed 85%.
The line doesn't decide the races either. The post with the chart says any state where Trump got under about 58.5% flipped, because 85% of that is under half. The chart works in shares of the two-party vote, and there the exact line is 58.8%. Of the races called so far, Republicans won Florida Senate and Vermont governor, where Trump had less than that, and a Democrat won South Carolina Senate, where he had more. South Carolina, which the post lists as under the line, was over it in the chart's own terms: Trump had 59.1% of the two-party vote there (58.2% of all votes).
The chart's 59 races are in 40 states, not all 50, and its governor panel leaves out 6 of the 34 governor races with one Democrat and one Republican: Wyoming, New Hampshire, Oregon, California, Maryland and Vermont. Its note says it excluded New Hampshire, Oregon and Vermont; it doesn't mention the other three. The six left out include every governor race where the Republican's share of the two-party vote was higher than Trump's in 2024: Wyoming, New Hampshire, Oregon and Vermont.
The chart's second formula, Democrat = Harris + 15% of Trump, is the first one written another way: in two-party shares the Democrat's share is 100% minus the Republican's, so whenever one formula fits, the other does too. It isn't a second finding.
The same test on 2018, against Trump's 2016 share: a middle of 94%, with about eight in ten races between 80% and 110%.
The same test on 2022, against Trump's 2020 share: a middle of 104%, with about eight in ten races between 93% and 115%.
So a band like this shows up in 2018 and 2022 too. A state's vote tracks its last one because most people keep voting for the same party, and a national mood moves most states the same way: toward Democrats in 2026, toward Democrats in 2018, toward Republicans in 2022.
A fixed ratio explains 70% of the differences between races in 2026, and a fixed shift of the same number of points everywhere explains 67%. A fixed ratio isn't a better fit than an ordinary swing.
Voters changing their minds and votes being switched would produce the same totals, so this pattern can't show either one. Only checks of the paper ballots can.
2026 Senate and governor races against the 2024 presidential vote
How far did each race move from the state's presidential vote?
Democrat aheadRepublican aheadNo changeThe patternFar from the pattern
Blue squares are good for Democrats and red squares for Republicans; the darker squares changed sides. Above the black line a race moved toward Democrats, even if it's still in a red square. Below it, toward Republicans.
59 moved toward Democrats, 5 toward Republicans. The middle shift is D +15.1.
The claim: Voting machines ran an algorithm that added 15% of Trump's 2024 vote totals to the 2026 Democratic votes in every single state.
Ruled out: in the Wyoming governor race, the Democrat got fewer votes than the formula says were added
In the Wyoming governor race, the Democrat got 27,469 votes in all, fewer than the 28,895 that 15% of Trump's 2024 vote there would be. If that many had been added, the Democrat's real vote would be below zero.
In 5 races the Republican's share of the two-party vote was as high as or higher than Trump's in 2024: Vermont governor, Wyoming governor, New Hampshire governor, Oregon governor and Maine Senate. Nothing moved toward Democrats there.
Across these 64 races, Democrats got between 28% and 94% of what Harris's 2024 votes plus 15% of Trump's would be, with a middle of 76%. Midterms draw fewer voters than presidential years, and the share differs widely by state, so no single formula fits every state.
Totals can't show what a machine did. Audits and recounts of the paper ballots can, and they're the place to look for a claim about machines.
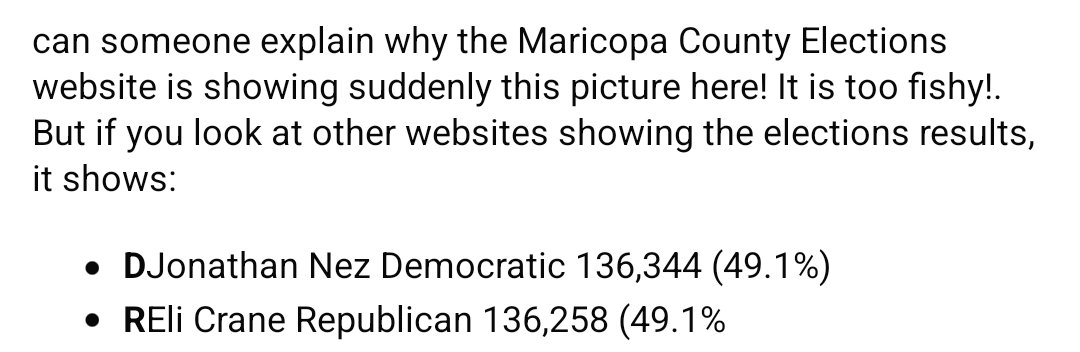
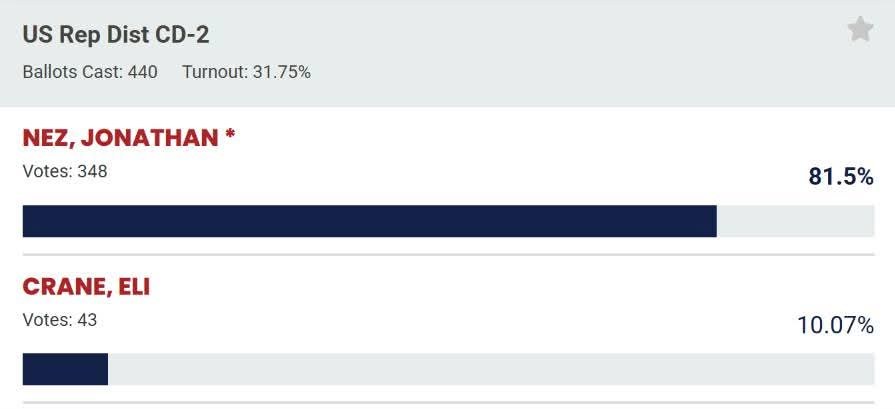
The claim: Maricopa County's elections website suddenly shows Nez 348 and Crane 43 in the 2nd District, while other websites show Nez 136,344 and Crane 136,258, which is too fishy.
The post's text, cropped so the group and the person who posted it don't show.The county results page the post shows. Select it to see it full size.
Not fraud: Maricopa's page shows only its corner of the district, 0.13% of the votes, and the other figures are an earlier snapshot of the whole count
Arizona's 2nd Congressional District spans 9 counties, and Maricopa County's results page counts only the ballots cast in its own part. Arizona's own count has 433 votes in this race there: Nez 353, Crane 43, Goodwin 36 and 1 write-in. The county page in the post shows Nez 348 and Crane 43, different from the state's figures for the county now.
That's 0.13% of the district's 329,857 votes. The rest come from 8 other counties, led by Yavapai (120,468) and Pinal (64,503).
Jonathan Nez has 81.5% of the votes in Maricopa's part and 48.5% across the district. A small area can vote very differently from the district around it, so one county's corner says little about the whole race.
The post's district-wide figures, Nez 136,344 and Crane 136,258, are exactly what Arizona's own results showed in the update of Nov 4, 5:24 AM Arizona time, with 277,538 votes counted. They're the whole district, partway through the count. Counting went on, and Crane took the lead in the update of Nov 4, 2:29 PM.
In the national count's updates this site recorded since Nov 3, 8:03 PM, the lead changed hands 5 times, the last time on Nov 4, 2:29 PM. In Arizona's own count, Crane leads by 3,446 now, 163,530 to 160,084. Counties report in batches on their own schedules, and different kinds of ballots are counted at different times, so a lead can change hands as the count goes on.
In Arizona's own count by kind of ballot: early ballots, Crane by 3,499; Election Day ballots, Nez by 290; the ballots the state lists as late early, Crane by 670.
These totals show where each set of figures comes from. They can't show whether any vote was recorded for the wrong candidate; only checks of the paper ballots, such as audits and recounts, can.
Arizona's 2nd District: votes by county
How much of the district's vote is in Maricopa County?
DemocraticRepublicanEveryone else
Yavapai120K
Pinal65K
Coconino56K
Navajo40K
Apache27K
Gila21K
Graham732
Mohave257
Maricopa (the post's county)433
The numbers
County
Democratic
Republican
Everyone else
Total
Yavapai
44,016
74,359
2,093
120,468
Pinal
30,957
32,149
1,397
64,503
Coconino
37,982
16,530
1,051
55,563
Navajo
19,350
19,862
814
40,026
Apache
19,399
7,246
389
27,034
Gila
7,185
13,225
431
20,841
Graham
664
54
14
732
Mohave
178
62
17
257
Maricopa (the post's county)
353
43
37
433
The district's count, update by update: the first, every change of lead, the post's figures and the latest
Update, Arizona time
From
Votes counted
Nez
Crane
Ahead
Nov 3, 8:03 PM
National count
34,550
24,382
9,646
Nez by 14,736
Nov 3, 8:08 PM
National count
160,427
78,659
79,327
Crane by 668
Nov 3, 8:11 PM
National count
185,803
91,969
91,015
Nez by 954
Nov 3, 10:54 PM
National count
214,007
104,571
106,017
Crane by 1,446
Nov 4, 12:30 AM
National count
227,632
112,196
111,750
Nez by 446
Nov 4, 5:24 AM (the post's figures)
Arizona's results
277,538
136,344
136,258
Nez by 86
Nov 4, 2:29 PM
National count
281,014
137,588
138,579
Crane by 991
Nov 10, 7:09 PM
Arizona's results
329,857
160,084
163,530
Crane by 3,446
Times are Arizona's own update stamps for its results, and the time this site recorded each update of the national count. The national count's latest total is 201 lower than Arizona's, the same as the district's write-in votes.
The claim: Hundreds of votes turned up on a memory card days after the election and flipped a Georgia House seat, which shows the count can't be trusted.
Real, and caught by the state's own check: a county failed to upload one memory card. Nothing official alleges fraud, and the state is investigating how it was missed
The story is real. Georgia's Secretary of State says that "during routine post-election checks" his office identified "approximately 388 more voters recorded as having checked in at polling places on Election Day than the number of ballots reported as cast in Seminole County." After the state told the county, its Board of Elections "determined that a memory card containing election results had not been uploaded into the county's election management system."
It changed who leads State House District 154. Before the card was added, the release says, Greene "trailed by less than 100 votes"; with it, "Greene now leads by 262 votes."
In Georgia's own results now, with 41 of 41 precincts in, Gerald Greene, the Republican incumbent, has 10,195 votes and Harry James, the Democrat, 9,944: Greene leads by 251, 1.2% of the 20,139 votes. The state's release of November 6 gave the lead as 262.
That's an error the state's own checks caught, and nothing official alleges fraud. The Secretary of State calls it "a failure to properly upload election results" and says "Georgia's election safeguards are designed to identify discrepancies, and that is exactly what these guardrails did."
The state is investigating "how the memory card was overlooked, whether required election procedures were followed, and what corrective measures are necessary." The release of November 6 gave county officials "until Monday to certify their election results."
Newsweek reports that the missing votes set off conspiracy theories on social media. Votes that were cast at polling places but left off the count are a real problem worth investigating; they aren't votes added from nowhere.
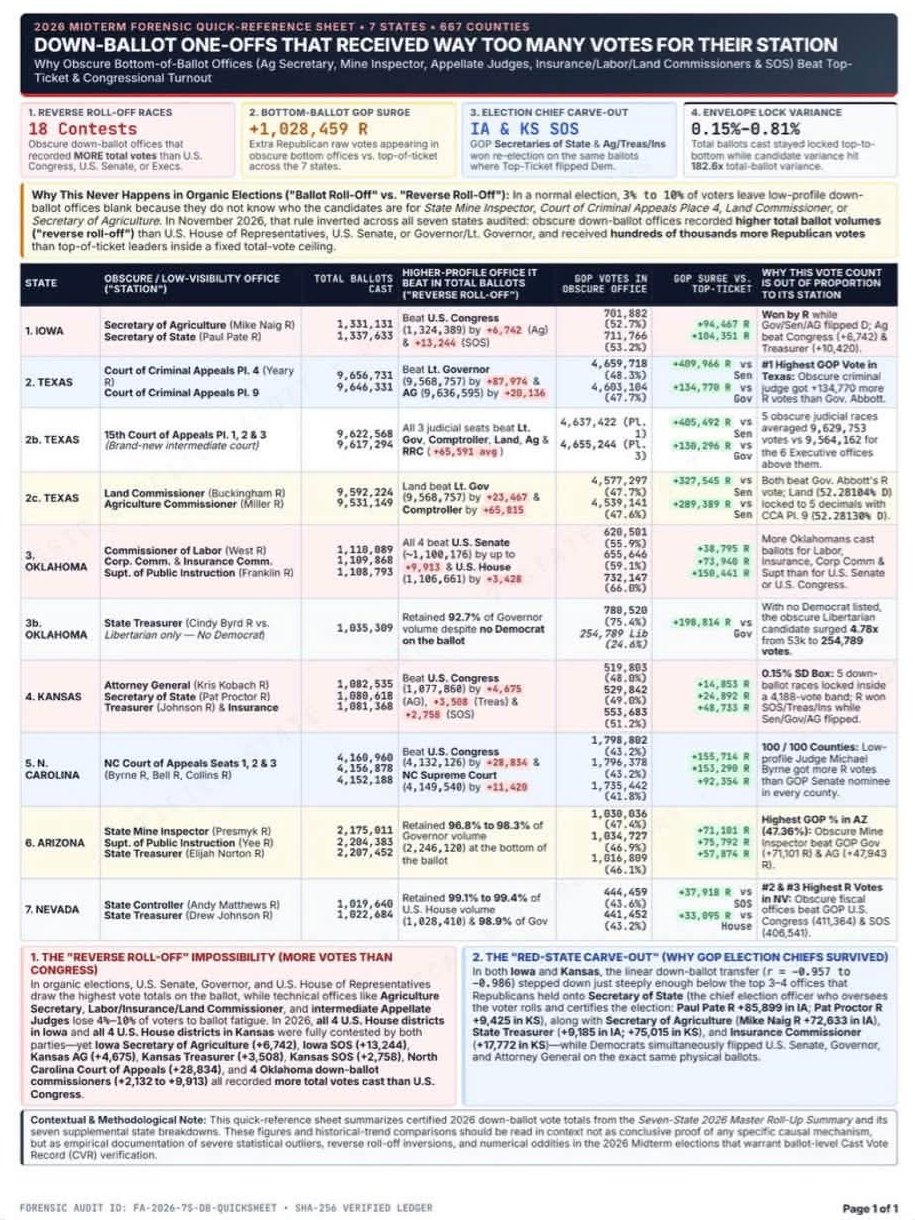
The claim: Obscure down-ballot offices got more votes than the U.S. House, Senate or governor in seven states, which never happens in an honest election.
What the post showed, cropped to its chart or table. Select it to see it full size.
Not true where it can be checked: every down-ballot office got fewer votes than the House
In Arizona, Kansas and North Carolina, whose down-ballot results this site reads from the states' own files, every statewide office got fewer votes than the state's U.S. House races combined. The post says in Kansas the attorney general, treasurer and secretary of state each got more votes than the U.S. House races combined, in North Carolina the Court of Appeals seats got about 28,834 more and in Arizona the mine inspector, superintendent and treasurer drew almost as many votes as the governor's race, with their Republicans out-polling the Republican for governor. Where a state's file has the House too, both sides of the comparison come from it; otherwise the House total is the national count, as the table says.
It does happen elsewhere this year, in states the post doesn't name: Arkansas (Secretary of State); California (Lieutenant Governor, Secretary of State, Controller, Treasurer, Attorney General); Florida (Attorney General, Chief Financial Officer, Commissioner of Agriculture); Georgia (Secretary of State, Attorney General); Indiana (Secretary of State); New York (Attorney General); Oklahoma (Lieutenant Governor); Texas (Lieutenant Governor, Attorney General); Wyoming (Secretary of State). That can happen when a House race has only one candidate or two from the same party, or when voters skip a House race.
In Arizona, the Republicans for state treasurer, superintendent of public instruction and state mine inspector each got more votes than the Republican for governor, by 68,478, 85,898 and 81,527 respectively, while each of those offices drew fewer votes in all than the governor's race. That fits voters splitting their tickets against one nominee, as in South Carolina and Texas below. Votes moved from one candidate to another would look the same in totals; only a check of the paper ballots can tell them apart.
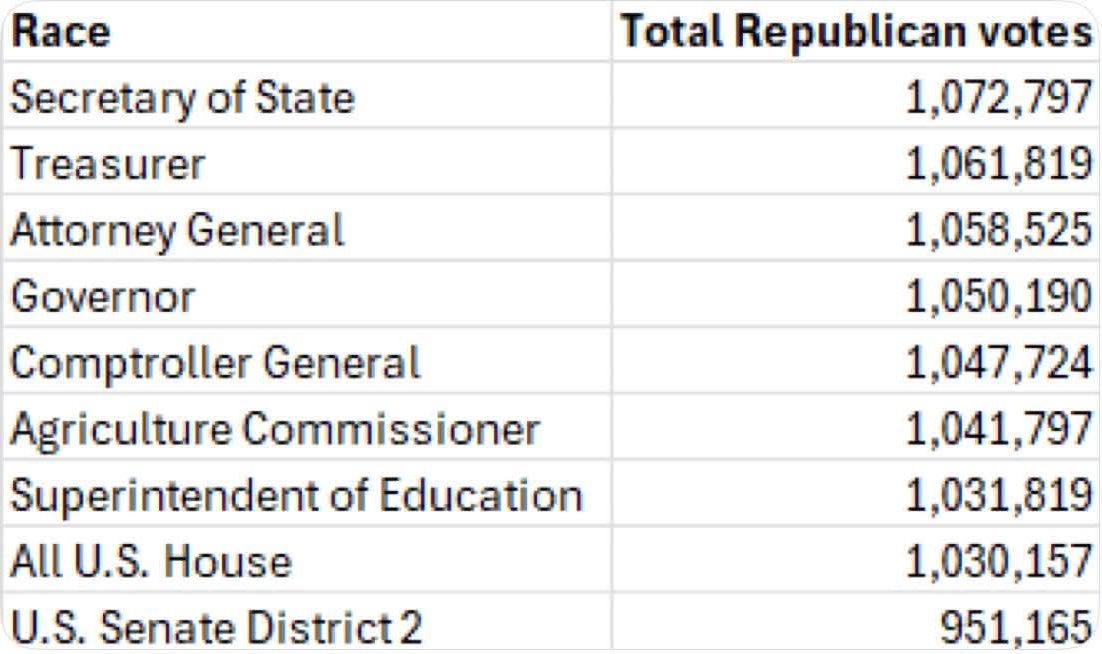
The claim: The Republican Senate candidate got about 100,000 fewer votes than the other Republicans on the ballot, which shows something is wrong.
What the post showed, cropped to its chart or table. Select it to see it full size.
No sign of fraud: both races drew about the same number of ballots, and the gap fits voters splitting their tickets
The Senate race drew 2,036,865 votes and the governor's race 2,037,292, 427 apart, about 0.02%.
The Republican Senate candidate has 99,159 fewer votes than the Republican for governor, the Democratic Senate candidate 83,477 more votes than the Democrat for governor, and other Senate candidates 15,255 more votes than other candidates for governor.
That fits voters splitting their tickets: about the same number of ballots, with one party's candidate losing votes that the other party's candidate gains. Votes moved from one candidate to another would look the same in these totals, so the totals can't rule that out; only a check of the paper ballots can.
The post's figures are within 1% of the count: it gives the Republican Senate candidate 951,165 and the Republican for governor 1,050,190, and the count has 952,308 and 1,051,467. The other down-ballot offices it lists aren't checked here, because this site doesn't read South Carolina's own file.
South Carolina: Senate and governor votes by party
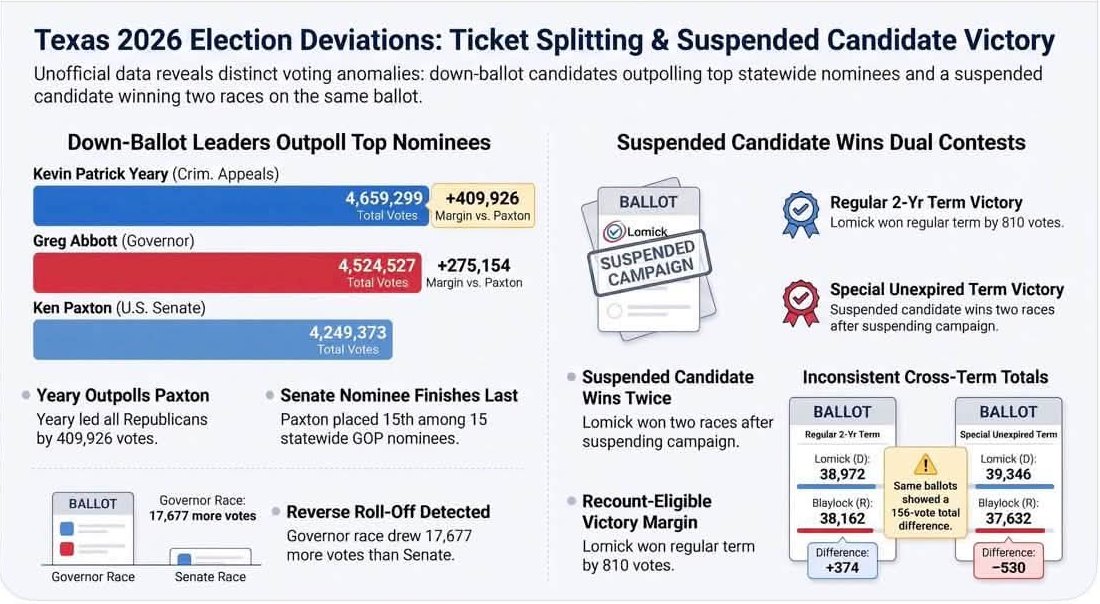
The claim: Down-ballot Republicans out-polled the Senate nominee, Ken Paxton, and the governor's race drew more votes than the Senate race, which shows the count was altered.
What the post showed, cropped to its chart or table. Select it to see it full size.
No sign of fraud: the gap fits voters splitting their tickets against Paxton
The Senate race drew 9,888,539 votes and the governor's race 9,906,918, 18,379 apart, about 0.19%.
The Republican Senate candidate has 275,188 fewer votes than the Republican for governor, the Democratic Senate candidate 214,360 more votes than the Democrat for governor, and other Senate candidates 42,449 more votes than other candidates for governor.
That fits voters splitting their tickets: about the same number of ballots, with one party's candidate losing votes that the other party's candidate gains. Votes moved from one candidate to another would look the same in these totals, so the totals can't rule that out; only a check of the paper ballots can.
The post gives Abbott 4,524,527 and Paxton 4,249,373, and says the governor's race drew 17,677 more votes. The count now has 4,526,038 and 4,250,850, within 1% of the post, and the governor's race has 18,379 more votes; the count has moved since the post. The down-ballot judges and the suspended candidate it mentions aren't checked here, because this site doesn't read Texas's own file yet.
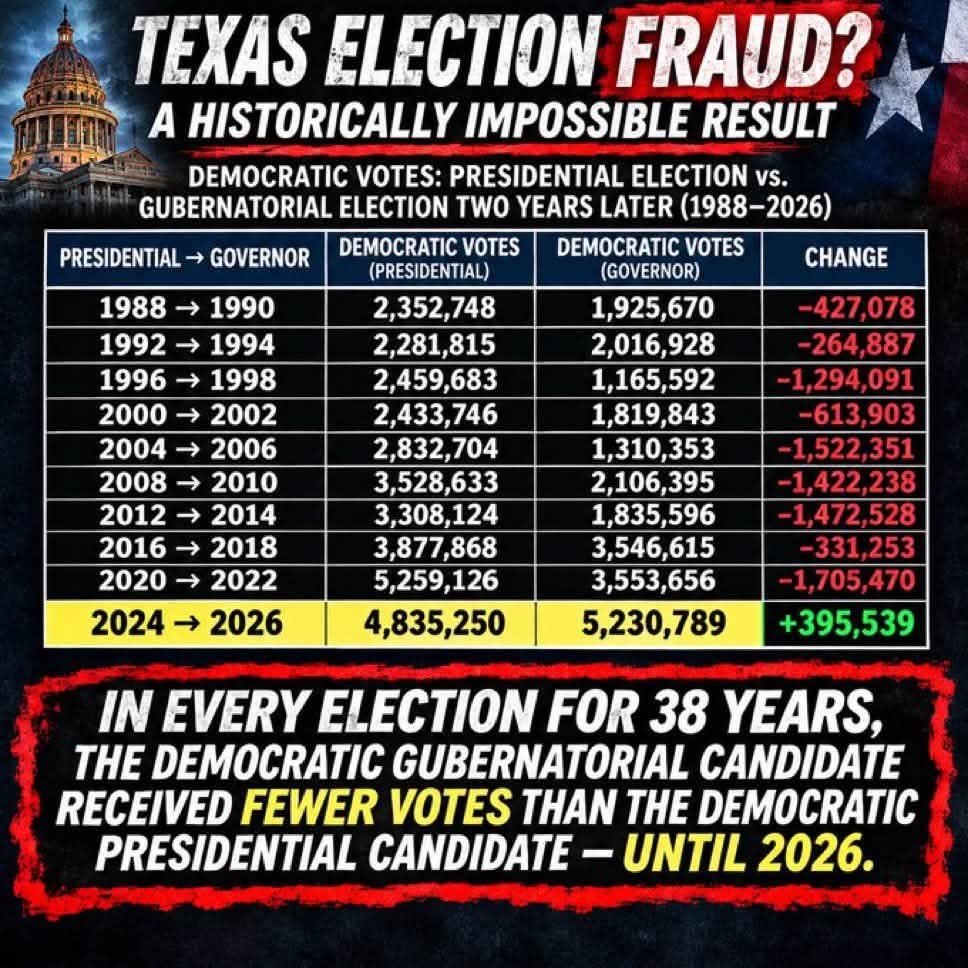
The claim: In every Texas election for 38 years, the Democrat for governor got fewer votes than the Democrat for president two years before, until 2026, which is historically impossible.
What the post showed, cropped to its chart or table. Select it to see it full size.
Not impossible, and not a sign of fraud: Democrats did it 102 times in midterms from 1978 to 2022
For the 5 earlier pairs this site's history covers, 4 match the post's figures exactly and the rest are within 16 votes.
For 1988, 1992, 1996 and 2000, the history has the presidential vote but not the governor's race two years later: the post's presidential figures match the official ones, and its governor figures aren't checked.
But a Democrat in a Texas midterm has out-polled the last Democratic presidential total before: in 2018 the Senate nominee got 4,045,632 votes, against 3,877,868 for the Democratic presidential candidate in 2016.
Across the country, a Democrat running against one Republican for Senate or governor out-polled the state's last Democratic presidential total 102 times in the midterms from 1978 to 2022, 24 of them in 2018 (governor races from 2002, Senate races from 1978).
In 2026 it has happened in 9 races in 7 states so far: Alabama, Iowa, Kansas, Mississippi, Oklahoma, South Carolina, Texas. It's a feature of this year's vote, not of Texas alone.
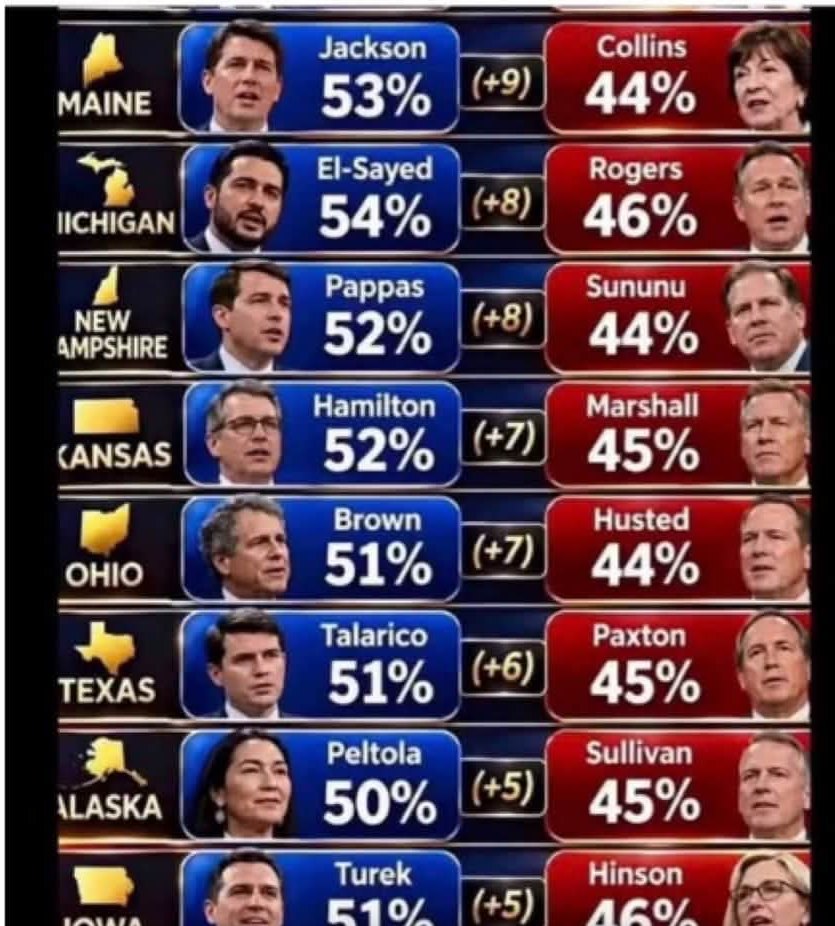
The claim: These Democratic Senate wins all came after midnight, which shows fraud.
What the post showed, cropped to its chart or table. Select it to see it full size.
No sign of fraud: the graphic's figures are off in 7 of 8 states, and leads that change after midnight are normal
In 7 of these 8 states, at least one of the graphic's figures is more than a point away from the count.
Maine and Alaska have no winner called yet.
This site keeps the latest count, not a record of when each batch of votes arrived, so it can't check what happened after midnight. Most states keep counting mail, early and provisional ballots after Election Day, so leads that change overnight or later are common in close races.
Democrats had more mail ballots than Republicans had voters: The post names no state, and the national count this site reads doesn't separate mail ballots in every state.
Reversing a 15% switch would flip New Jersey's 2025 governor's race: This site doesn't cover New Jersey's 2025 election.
Sources: results from 2000 to 2024 and presidential results since 1976 are from Polling Forecast's results history, which compiles official returns and the MIT Election Data and Science Lab's files; each row carries its own license. Senate and House results from 1976 to 1998 are the MIT Election Data and Science Lab's (CC0), compiled from the Clerk of the House's official statistics. Governor results start in 2000. 2026 figures are this site's count, from the states' own files for Arizona, Kansas and North Carolina's down-ballot offices. Times are Arizona time.