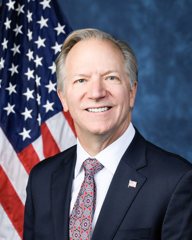
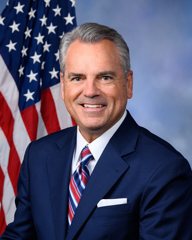
2026 election results. Bethany Mann (D) got 64% of the Missouri 3rd District vote in Boone County. The margin is 17.1 points more Democratic than the 2024 presidential vote here. Boone County is split between 2 U.S. House districts. Below are also 13 local contests from the county's own results.
Only part of Boone County is in this district; these are that part's votes. Whole district: Mark Alford wins. Called.
The leader in Boone County is only who has the most votes counted here. Races are won statewide or district-wide, and only the race pages report calls. Last vote update here Nov 3, 10:50 PM.
13 local contests in Boone County
County offices, local measures, judges and other local offices on Boone County's ballots, from Boone County's precinct results file. Names are as the county prints them. "Ahead" describes the current count; it isn't a race call, and we don't call measures. The county's site also lists its votes for the State Auditor, the state legislature, the Missouri Supreme Court and Court of Appeals retention questions, and the statewide amendments and Proposition A, which aren't shown here.
County offices
For Presiding Commissioner
Candidate
Votes
Share
Kip Kendrick D
46,499
99.3%
Write-in
349
0.7%
Kip Kendrick is unopposed.
For County Auditor
Candidate
Votes
Share
Kyle Rieman D
45,610
99.2%
Write-in
377
0.8%
Kyle Rieman is unopposed.
For Circuit Clerk
Candidate
Votes
Share
Sherry Terrell D
45,691
99.3%
Write-in
339
0.7%
Sherry Terrell is unopposed.
For County Clerk
Candidate
Votes
Share
Brianna L. Lennon D
46,621
99.3%
Write-in
346
0.7%
Brianna L. Lennon is unopposed.
For Prosecuting Attorney
Candidate
Votes
Share
Melissa "Mel" Buchanan D
45,507
99.3%
Write-in
327
0.7%
Melissa "Mel" Buchanan is unopposed.
Local measures
Proposition L:
Choice
Votes
Share
No
39,372
59.8%
Yes
26,427
40.2%
No ahead with 59.8% in Boone County.
Judges
For Circuit Judge Circuit 13 Division 4
Candidate
Votes
Share
Josh Devine R
35,770
96.6%
Write-in
1,264
3.4%
Josh Devine is unopposed.
For Associate Circuit Judge Circuit 13 Division 5
Candidate
Votes
Share
Kimberly Shaw D
46,087
99.2%
Write-in
388
0.8%
Kimberly Shaw is unopposed.
For Associate Circuit Judge Circuit 13 Division 9
Candidate
Votes
Share
Bill Ellis D
40,927
63.9%
James Egan R
23,097
36.1%
Write-in
29
0.0%
Bill Ellis ahead in Boone County.
For Associate Circuit Judge Circuit 13 Division 10
Candidate
Votes
Share
Kayla I. Jackson-Williams D
45,696
99.2%
Write-in
384
0.8%
Kayla I. Jackson-Williams is unopposed.
For Associate Circuit Judge Circuit 13 Division 11
Margins compare the Democrat and the Republican only. The 2024 column is the presidential margin in the same places as each race's votes here. Shift is this year's margin minus it, shown once at least 90% of the expected vote is counted. A dash means there's no 2024 figure for those exact places.
How Boone County has voted for president
Year
Democrat
Share
Republican
Share
Margin
Votes
2024
Kamala Harris
53.8%
Donald Trump
44.0%
D +9.7
90,110
2020
Joe Biden
54.9%
Donald Trump
42.4%
D +12.5
91,127
2016
Hillary Clinton
49.0%
Donald Trump
43.2%
D +5.9
83,868
2012
Barack Obama
50.2%
Mitt Romney
47.1%
D +3.1
79,422
2008
Barack Obama
55.2%
John McCain
43.2%
D +12.0
85,251
2004
John Kerry
49.5%
George W. Bush
49.7%
R +0.2
76,046
2000
Al Gore
48.3%
George W. Bush
47.7%
D +0.6
59,609
Shares are of all presidential votes, and the margin is the Democrat's share minus the Republican's. Since 2000, the presidential margin here has moved D +9.1.
Votes for 2026 come from the count this site reads, by county. They're unofficial until Missouri certifies them. Past presidential votes are from MEDSL and VEST, via Polling Forecast. Missouri's own results, deadlines and offices are on the state page.