U.S. Senate
Larry Marker
62.0%1,727
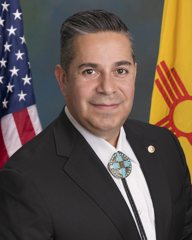
Ben Ray Lujan
38.0%1,060
Statewide: Ben Ray Lujan wins. Called.
 Electoral MeridianIndependent Election Research
Forecasts. Results. Evidence.
2026 election results. Larry Marker (R) got 62% of the U.S. Senate vote in Quay County. The margin is 17.9 points more Democratic than the 2024 presidential vote here. Below are also 9 local contests from the state's own results.
Statewide: Ben Ray Lujan wins. Called.
Statewide: Deb Haaland wins. Called.
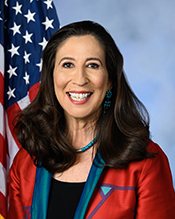
Whole district: Teresa Fernandez wins. Called.
The leader in Quay County is only who has the most votes counted here. Races are won statewide or district-wide, and only the race pages report calls. Last vote update here Nov 5, 12:50 PM.
County offices and judges on Quay County's ballots, from New Mexico's official results file. Names are as the state prints them. "Ahead" describes the current count; it isn't a race call, and we don't call measures.
| Candidate | Votes | Share |
|---|---|---|
| Brian Dale Fortner R | 2,167 | 100.0% |
Brian Dale Fortner is unopposed.
| Candidate | Votes | Share |
|---|---|---|
| Dennis Victor Garcia R | 2,298 | 100.0% |
Dennis Victor Garcia is unopposed.
| Candidate | Votes | Share |
|---|---|---|
| Jefferson L Byrd R | 2,105 | 100.0% |
Jefferson L Byrd is unopposed.
| Candidate | Votes | Share |
|---|---|---|
| Timothy L Rose I | 2,065 | 100.0% |
Timothy L Rose is unopposed. The contest crosses into 2 other counties; across all of them: Timothy L Rose 2,747 (100.0%).
| Candidate | Votes | Share |
|---|---|---|
| Noreen L Hendrickson R | 1,554 | 56.3% |
| Amanda L Hammer D | 1,206 | 43.7% |
Noreen L Hendrickson ahead in Quay County.
| Candidate | Votes | Share |
|---|---|---|
| Christina Lucille Mayfield Wilson R | 2,114 | 100.0% |
Christina Lucille Mayfield Wilson is unopposed.
| Choice | Votes | Share |
|---|---|---|
| Yes | 1,539 | 67.1% |
| No | 756 | 32.9% |
Yes ahead with 67.1% in Quay County. The contest crosses into 32 other counties; across all of them: Yes 400,874 (68.6%), No 183,099 (31.4%).
| Choice | Votes | Share |
|---|---|---|
| Yes | 1,467 | 64.5% |
| No | 809 | 35.5% |
Yes ahead with 64.5% in Quay County. The contest crosses into 32 other counties; across all of them: Yes 397,732 (68.4%), No 183,418 (31.6%).
| Choice | Votes | Share |
|---|---|---|
| Yes | 1,558 | 69.1% |
| No | 697 | 30.9% |
Yes ahead with 69.1% in Quay County. The contest crosses into 32 other counties; across all of them: Yes 385,336 (67.4%), No 186,502 (32.6%).
New Mexico's official results, these figures first read Nov 12, 11:27 AM. Unofficial until certified.
| Race | Margin | 2024 president | Shift |
|---|---|---|---|
| NM Senate | R +23.9 | R +41.8 | D +17.9 |
| NM Governor | R +34.3 | R +41.8 | D +7.5 |
| NM-03 | R +32.8 | R +41.8 | D +9.0 |
Margins compare the Democrat and the Republican only. The 2024 column is the presidential margin in the same places as each race's votes here. Shift is this year's margin minus it, shown once at least 90% of the expected vote is counted. A dash means there's no 2024 figure for those exact places.
| Year | Democrat | Share | Republican | Share | Margin |
|---|---|---|---|---|---|
| 2024 | Kamala Harris | 28.3% | Donald Trump | 69.4% | R +41.1 |
| 2020 | Joe Biden | 30.2% | Donald Trump | 68.0% | R +37.8 |
| 2016 | Hillary Clinton | 28.5% | Donald Trump | 61.9% | R +33.5 |
| 2012 | Barack Obama | 37.3% | Mitt Romney | 59.4% | R +22.1 |
| 2008 | Barack Obama | 38.7% | John McCain | 59.2% | R +20.5 |
| 2004 | John Kerry | 34.5% | George W. Bush | 64.6% | R +30.1 |
| 2000 | Al Gore | 38.3% | George W. Bush | 59.6% | R +21.4 |
Shares are of all presidential votes, and the margin is the Democrat's share minus the Republican's. Since 2000, the presidential margin here has moved R +19.7.
Votes for 2026 come from the count this site reads, by county. They're unofficial until New Mexico certifies them. Past presidential votes are from MEDSL and VEST, via Polling Forecast. New Mexico's own results, deadlines and offices are on the state page.