U.S. Senate (special)
Sherrod Brown
60.5%207,080
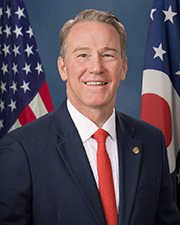
Jon Husted
35.2%120,368
Greg Levy
2.2%7,456
William Redpath
2.1%7,283
Statewide: Sherrod Brown wins. Called.
 Electoral MeridianIndependent Election Research
Forecasts. Results. Evidence.
2026 election results. Amy Acton (D) got 63% of the vote for governor in Hamilton County. The margin is 14.2 points more Democratic than the 2024 presidential vote here. Hamilton County is split between 2 U.S. House districts. Below are also 47 local contests from the county's own results.
Statewide: Sherrod Brown wins. Called.
Statewide: Amy Acton wins. Called.
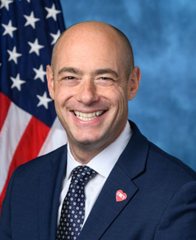
Only part of Hamilton County is in this district; these are that part's votes. Whole district: Greg Landsman wins. Called.
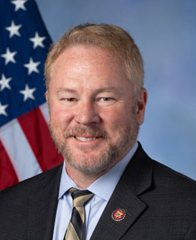
Only part of Hamilton County is in this district; these are that part's votes. Whole district: Warren Davidson wins. Called.
The leader in Hamilton County is only who has the most votes counted here. Races are won statewide or district-wide, and only the race pages report calls. Last vote update here Nov 3, 9:51 PM.
County offices, local measures and judges on Hamilton County's ballots, from Hamilton County's election-night results. Names are as the county prints them. "Ahead" describes the current count; it isn't a race call, and we don't call measures. The county's site also lists its votes for Ohio's other statewide offices, the Supreme Court, statewide Issue 3 and the state legislature, which aren't shown here.
| Candidate | Votes | Share |
|---|---|---|
| Meeka Owens D | 198,464 | 60.9% |
| Jonathan Pearson R | 126,640 | 38.9% |
| Carrie R. Davis | 538 | 0.2% |
Meeka Owens ahead in Hamilton County.
| Candidate | Votes | Share |
|---|---|---|
| Jessica E. Miranda D | 226,758 | 100.0% |
Jessica E. Miranda is unopposed.
| Choice | Votes | Share |
|---|---|---|
| For The Tax Levy | 73,935 | 60.9% |
| Against The Tax Levy | 47,426 | 39.1% |
For The Tax Levy ahead with 60.9% in Hamilton County.
| Choice | Votes | Share |
|---|---|---|
| Against The Tax | 1,938 | 52.4% |
| For The Tax | 1,763 | 47.6% |
Against The Tax ahead with 52.4% in Hamilton County.
| Choice | Votes | Share |
|---|---|---|
| Against The Tax | 18,670 | 57.1% |
| For The Tax | 14,014 | 42.9% |
Against The Tax ahead with 57.1% in Hamilton County.
| Choice | Votes | Share |
|---|---|---|
| Against The Tax | 6,966 | 63.6% |
| For The Tax | 3,985 | 36.4% |
Against The Tax ahead with 63.6% in Hamilton County.
| Choice | Votes | Share |
|---|---|---|
| For The Tax Levy | 10,742 | 57.6% |
| Against The Tax Levy | 7,898 | 42.4% |
For The Tax Levy ahead with 57.6% in Hamilton County.
| Choice | Votes | Share |
|---|---|---|
| Against The Tax Levy | 6,080 | 55.6% |
| For The Tax Levy | 4,851 | 44.4% |
Against The Tax Levy ahead with 55.6% in Hamilton County.
| Choice | Votes | Share |
|---|---|---|
| For The Tax Levy | 191,100 | 56.6% |
| Against The Tax Levy | 146,651 | 43.4% |
For The Tax Levy ahead with 56.6% in Hamilton County.
| Choice | Votes | Share |
|---|---|---|
| For The Tax Levy | 1,741 | 60.3% |
| Against The Tax Levy | 1,147 | 39.7% |
For The Tax Levy ahead with 60.3% in Hamilton County.
| Choice | Votes | Share |
|---|---|---|
| Yes | 298 | 69.1% |
| No | 133 | 30.9% |
Yes ahead with 69.1% in Hamilton County.
| Choice | Votes | Share |
|---|---|---|
| For The Tax Levy | 1,453 | 59.1% |
| Against The Tax Levy | 1,007 | 40.9% |
For The Tax Levy ahead with 59.1% in Hamilton County.
| Choice | Votes | Share |
|---|---|---|
| Against The Tax Levy | 3,434 | 52.5% |
| For The Tax Levy | 3,103 | 47.5% |
Against The Tax Levy ahead with 52.5% in Hamilton County.
| Choice | Votes | Share |
|---|---|---|
| No | 2,460 | 52.4% |
| Yes | 2,236 | 47.6% |
No ahead with 52.4% in Hamilton County.
| Choice | Votes | Share |
|---|---|---|
| No | 2,637 | 50.8% |
| Yes | 2,551 | 49.2% |
No ahead with 50.8% in Hamilton County.
| Choice | Votes | Share |
|---|---|---|
| For The Tax Levy | 4,001 | 60.5% |
| Against The Tax Levy | 2,607 | 39.5% |
For The Tax Levy ahead with 60.5% in Hamilton County.
| Choice | Votes | Share |
|---|---|---|
| Yes | 3,848 | 78.5% |
| No | 1,053 | 21.5% |
Yes ahead with 78.5% in Hamilton County.
| Choice | Votes | Share |
|---|---|---|
| Against The Tax Levy | 101 | 57.4% |
| For The Tax Levy | 75 | 42.6% |
Against The Tax Levy ahead with 57.4% in Hamilton County.
| Choice | Votes | Share |
|---|---|---|
| For The Tax Levy | 560 | 67.3% |
| Against The Tax Levy | 272 | 32.7% |
For The Tax Levy ahead with 67.3% in Hamilton County.
| Choice | Votes | Share |
|---|---|---|
| For The Tax Levy | 1,011 | 67.0% |
| Against The Tax Levy | 497 | 33.0% |
For The Tax Levy ahead with 67.0% in Hamilton County.
| Choice | Votes | Share |
|---|---|---|
| For The Tax Levy | 1,038 | 68.3% |
| Against The Tax Levy | 482 | 31.7% |
For The Tax Levy ahead with 68.3% in Hamilton County.
| Choice | Votes | Share |
|---|---|---|
| For The Tax Levy | 826 | 56.2% |
| Against The Tax Levy | 643 | 43.8% |
For The Tax Levy ahead with 56.2% in Hamilton County.
| Choice | Votes | Share |
|---|---|---|
| For The Tax Levy | 781 | 53.2% |
| Against The Tax Levy | 686 | 46.8% |
For The Tax Levy ahead with 53.2% in Hamilton County.
| Choice | Votes | Share |
|---|---|---|
| For The Tax Levy | 934 | 58.4% |
| Against The Tax Levy | 665 | 41.6% |
For The Tax Levy ahead with 58.4% in Hamilton County.
| Choice | Votes | Share |
|---|---|---|
| For The Tax Levy | 456 | 52.4% |
| Against The Tax Levy | 414 | 47.6% |
For The Tax Levy ahead with 52.4% in Hamilton County.
| Choice | Votes | Share |
|---|---|---|
| For The Tax Levy | 1,527 | 78.4% |
| Against The Tax Levy | 420 | 21.6% |
For The Tax Levy ahead with 78.4% in Hamilton County.
| Choice | Votes | Share |
|---|---|---|
| For The Tax Levy | 355 | 69.9% |
| Against The Tax Levy | 153 | 30.1% |
For The Tax Levy ahead with 69.9% in Hamilton County.
| Choice | Votes | Share |
|---|---|---|
| Yes | 1,101 | 66.0% |
| No | 567 | 34.0% |
Yes ahead with 66.0% in Hamilton County.
| Choice | Votes | Share |
|---|---|---|
| For The Tax Levy | 1,098 | 84.5% |
| Against The Tax Levy | 201 | 15.5% |
For The Tax Levy ahead with 84.5% in Hamilton County.
| Choice | Votes | Share |
|---|---|---|
| Yes | 784 | 92.5% |
| No | 64 | 7.5% |
Yes ahead with 92.5% in Hamilton County.
| Choice | Votes | Share |
|---|---|---|
| For The Tax Levy | 4,234 | 54.5% |
| Against The Tax Levy | 3,538 | 45.5% |
For The Tax Levy ahead with 54.5% in Hamilton County.
| Choice | Votes | Share |
|---|---|---|
| Yes | 574 | 72.2% |
| No | 221 | 27.8% |
Yes ahead with 72.2% in Hamilton County.
| Candidate | Votes | Share |
|---|---|---|
| Ginger S. Bock D | 231,836 | 100.0% |
Ginger S. Bock is unopposed.
| Candidate | Votes | Share |
|---|---|---|
| Donte Johnson | 163,715 | 55.0% |
| Katie Casch | 133,985 | 45.0% |
Donte Johnson ahead in Hamilton County.
| Candidate | Votes | Share |
|---|---|---|
| Christian A. Jenkins | 168,645 | 57.0% |
| Betsy Sundermann | 127,375 | 43.0% |
Christian A. Jenkins ahead in Hamilton County.
| Candidate | Votes | Share |
|---|---|---|
| Chris Wagner | 211,877 | 100.0% |
Chris Wagner is unopposed.
| Candidate | Votes | Share |
|---|---|---|
| Jennifer Branch | 190,283 | 65.2% |
| Roger Bouchard | 101,646 | 34.8% |
Jennifer Branch ahead in Hamilton County.
| Candidate | Votes | Share |
|---|---|---|
| Alan C. Triggs | 172,017 | 59.2% |
| Dennis Charles Mahoney | 118,708 | 40.8% |
Alan C. Triggs ahead in Hamilton County.
| Candidate | Votes | Share |
|---|---|---|
| Latoya S. Maley | 167,709 | 55.8% |
| Robert A. Goering | 132,819 | 44.2% |
Latoya S. Maley ahead in Hamilton County.
| Candidate | Votes | Share |
|---|---|---|
| Wende C. Cross | 211,176 | 100.0% |
Wende C. Cross is unopposed.
| Candidate | Votes | Share |
|---|---|---|
| Alison Hatheway | 210,824 | 100.0% |
Alison Hatheway is unopposed.
| Candidate | Votes | Share |
|---|---|---|
| Nicole L. Sanders | 211,839 | 100.0% |
Nicole L. Sanders is unopposed.
| Candidate | Votes | Share |
|---|---|---|
| Elizabeth A. Tye | 170,659 | 55.9% |
| Ralph Winkler | 134,731 | 44.1% |
Elizabeth A. Tye ahead in Hamilton County.
| Candidate | Votes | Share |
|---|---|---|
| Kari L. Bloom | 167,473 | 57.0% |
| Susan Luken | 126,354 | 43.0% |
Kari L. Bloom ahead in Hamilton County.
| Candidate | Votes | Share |
|---|---|---|
| Tiffany Evans | 210,370 | 100.0% |
Tiffany Evans is unopposed.
| Candidate | Votes | Share |
|---|---|---|
| Sarah Henry | 171,140 | 59.0% |
| Chris McDowell | 118,997 | 41.0% |
Sarah Henry ahead in Hamilton County.
| Candidate | Votes | Share |
|---|---|---|
| Manisha Kotian | 154,793 | 52.5% |
| Leah Dinkelacker | 139,809 | 47.5% |
Manisha Kotian ahead in Hamilton County.
Hamilton County's election-night results, last updated Nov 3, 9:38 PM. Unofficial until certified.
| Race | Margin | 2024 president | Shift |
|---|---|---|---|
| OH Senate (special) | D +26.5 | D +15.0 | D +11.4 |
| OH Governor | D +29.3 | D +15.0 | D +14.2 |
| OH-01 part of the county | D +32.5 | D +19.1 | D +13.4 |
| OH-08 part of the county | D +19.5 | D +9.4 | D +10.1 |
Margins compare the Democrat and the Republican only. The 2024 column is the presidential margin in the same places as each race's votes here. Shift is this year's margin minus it, shown once at least 90% of the expected vote is counted. A dash means there's no 2024 figure for those exact places.
| Year | Democrat | Share | Republican | Share | Margin |
|---|---|---|---|---|---|
| 2024 | Kamala Harris | 56.9% | Donald Trump | 42.0% | D +14.9 |
| 2020 | Joe Biden | 57.2% | Donald Trump | 41.3% | D +15.9 |
| 2016 | Hillary Clinton | 52.7% | Donald Trump | 42.4% | D +10.3 |
| 2012 | Barack Obama | 52.5% | Mitt Romney | 46.2% | D +6.4 |
| 2008 | Barack Obama | 53.0% | John McCain | 46.0% | D +7.0 |
| 2004 | John Kerry | 47.1% | George W. Bush | 52.5% | R +5.4 |
| 2000 | Al Gore | 42.8% | George W. Bush | 54.0% | R +11.3 |
Shares are of all presidential votes, and the margin is the Democrat's share minus the Republican's. Since 2000, the presidential margin here has moved D +26.2.
Votes for 2026 come from the count this site reads, by county. They're unofficial until Ohio certifies them. Past presidential votes are from MEDSL and VEST, via Polling Forecast. Ohio's own results, deadlines and offices are on the state page.