Governor
Wes Moore
57.5%66,338
Dan Cox
38.7%44,608
Andy Ellis
2.2%2,479
Cathy White
1.6%1,851
Statewide: Wes Moore wins. Called.
 Electoral MeridianIndependent Election Research
Forecasts. Results. Evidence.
2026 election results. Wes Moore (D) has 58% of the vote for governor in Frederick County, with about 99% of the expected vote counted. The margin is 10.6 points more Democratic than the 2024 presidential vote here. Below are also 16 local contests from the state's own results.
Statewide: Wes Moore wins. Called.
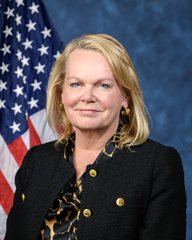
Whole district: April McClain-Delaney wins. Called.
The leader in Frederick County is only who has the most votes counted here. Races are won statewide or district-wide, and only the race pages report calls. Last vote update here Nov 13, 10:39 AM.
County offices, school boards, local measures and judges on Frederick County's ballots, from Maryland's official results file. Names are as the state prints them. "Ahead" describes the current count; it isn't a race call, and we don't call measures.
| Candidate | Votes | Share |
|---|---|---|
| Jessica Fitzwater D | 68,331 | 59.4% |
| William J. Holtzinger R | 46,525 | 40.4% |
| Other Write-Ins | 250 | 0.2% |
Jessica Fitzwater ahead in Frederick County.
| Candidate | Votes | Share |
|---|---|---|
| Tiffany Grant D | 67,125 | 31.0% |
| Renee Knapp D | 63,730 | 29.4% |
| Diane Fouche R | 42,795 | 19.8% |
| Jack Felton R | 42,625 | 19.7% |
| Other Write-Ins | 225 | 0.1% |
Tiffany Grant and Renee Knapp ahead in Frederick County.
| Candidate | Votes | Share |
|---|---|---|
| Louisa Conklin D | 15,617 | 59.9% |
| Frank J. Hollewa R | 10,415 | 40.0% |
| Other Write-Ins | 29 | 0.1% |
Louisa Conklin ahead in Frederick County.
| Candidate | Votes | Share |
|---|---|---|
| Jamie Shopland D | 13,172 | 55.4% |
| Dan Iampieri R | 10,569 | 44.5% |
| Other Write-Ins | 25 | 0.1% |
Jamie Shopland ahead in Frederick County.
| Candidate | Votes | Share |
|---|---|---|
| Christian Benford D | 14,669 | 75.0% |
| Tammie Baugher R | 4,858 | 24.8% |
| Other Write-Ins | 24 | 0.1% |
Christian Benford ahead in Frederick County.
| Candidate | Votes | Share |
|---|---|---|
| Kavonte Duckett D | 16,657 | 72.2% |
| Chaz Packan R | 6,383 | 27.7% |
| Other Write-Ins | 26 | 0.1% |
Kavonte Duckett ahead in Frederick County.
| Candidate | Votes | Share |
|---|---|---|
| Mason Carter R | 12,804 | 58.7% |
| Johnny Mercer D | 8,992 | 41.2% |
| Other Write-Ins | 19 | 0.1% |
Mason Carter ahead in Frederick County.
| Candidate | Votes | Share |
|---|---|---|
| Charlie Smith R | 70,820 | 93.5% |
| Other Write-Ins | 4,927 | 6.5% |
Charlie Smith is unopposed.
| Candidate | Votes | Share |
|---|---|---|
| Megan LeRoux D | 65,477 | 57.5% |
| Sandra K. Dalton R | 48,318 | 42.4% |
| Other Write-Ins | 47 | 0.0% |
Megan LeRoux ahead in Frederick County.
| Candidate | Votes | Share |
|---|---|---|
| Chris Manners D | 64,102 | 57.0% |
| Mary C. Rolle R | 48,312 | 43.0% |
| Other Write-Ins | 47 | 0.0% |
Chris Manners ahead in Frederick County.
| Candidate | Votes | Share |
|---|---|---|
| Karl Bickel D | 67,164 | 59.3% |
| Chuck Jenkins R | 45,939 | 40.6% |
| Other Write-Ins | 139 | 0.1% |
Karl Bickel ahead in Frederick County.
| Candidate | Votes | Share |
|---|---|---|
| Casey Day | 55,892 | 15.6% |
| Rae Gallagher | 52,992 | 14.8% |
| Dean Rose | 51,128 | 14.2% |
| Chad King Wilson, Sr. | 46,560 | 13.0% |
| Heather Fletcher | 44,252 | 12.3% |
| Shelley L. Potter | 40,683 | 11.3% |
| Tyler Walker | 34,499 | 9.6% |
| Geoffrey Seidel | 32,004 | 8.9% |
| Other Write-Ins | 952 | 0.3% |
Casey Day, Rae Gallagher, Dean Rose and Chad King Wilson, Sr. ahead in Frederick County.
| Choice | Votes | Share |
|---|---|---|
| For the Charter Amendment | 91,211 | 82.8% |
| Against the Charter Amendment | 18,884 | 17.2% |
For the Charter Amendment ahead with 82.8% in Frederick County.
| Candidate | Votes | Share |
|---|---|---|
| Julia Ann Minner | 84,121 | 98.5% |
| Other Write-Ins | 1,241 | 1.5% |
Julia Ann Minner is unopposed.
| Choice | Votes | Share |
|---|---|---|
| Yes | 77,383 | 84.5% |
| No | 14,219 | 15.5% |
Yes ahead with 84.5% in Frederick County. The contest crosses into 23 other counties; across all of them: Yes 1,535,519 (84.0%), No 291,559 (16.0%).
| Candidate | Votes | Share |
|---|---|---|
| Susan Reeder Jessee D | 64,287 | 20.5% |
| Shuan Butcher D | 62,940 | 20.1% |
| Lois Jarman D | 62,354 | 19.9% |
| Susan W. Wilson R | 42,002 | 13.4% |
| Karen Dacey R | 41,304 | 13.2% |
| Rebecca Chmelik R | 40,394 | 12.9% |
| Other Write-Ins | 142 | 0.0% |
Susan Reeder Jessee, Shuan Butcher and Lois Jarman ahead in Frederick County.
Maryland's official results, these figures first read Nov 13, 6:04 PM. Unofficial until certified.
| Race | Margin | 2024 president | Shift |
|---|---|---|---|
| MD Governor | D +19.6 | D +9.0 | D +10.6 |
| MD-06 | D +24.0 | D +9.0 | D +14.9 |
Margins compare the Democrat and the Republican only. The 2024 column is the presidential margin in the same places as each race's votes here. Shift is this year's margin minus it, shown once at least 90% of the expected vote is counted. A dash means there's no 2024 figure for those exact places.
| Year | Democrat | Share | Republican | Share | Margin |
|---|---|---|---|---|---|
| 2024 | Kamala Harris | 52.8% | Donald Trump | 44.0% | D +8.7 |
| 2020 | Joe Biden | 53.3% | Donald Trump | 43.7% | D +9.6 |
| 2016 | Hillary Clinton | 45.0% | Donald Trump | 47.4% | R +2.4 |
| 2012 | Barack Obama | 47.1% | Mitt Romney | 50.2% | R +3.1 |
| 2008 | Barack Obama | 48.6% | John McCain | 49.6% | R +1.0 |
| 2004 | John Kerry | 39.3% | George W. Bush | 59.6% | R +20.3 |
| 2000 | Al Gore | 39.1% | George W. Bush | 57.7% | R +18.6 |
Shares are of all presidential votes, and the margin is the Democrat's share minus the Republican's. Since 2000, the presidential margin here has moved D +27.3.
Votes for 2026 come from the count this site reads, by county. They're unofficial until Maryland certifies them. Past presidential votes are from MEDSL and VEST, via Polling Forecast. Maryland's own results, deadlines and offices are on the state page.